\n
## Line Chart: Accuracy and Data Count vs. Retrieved Knowledge
### Overview
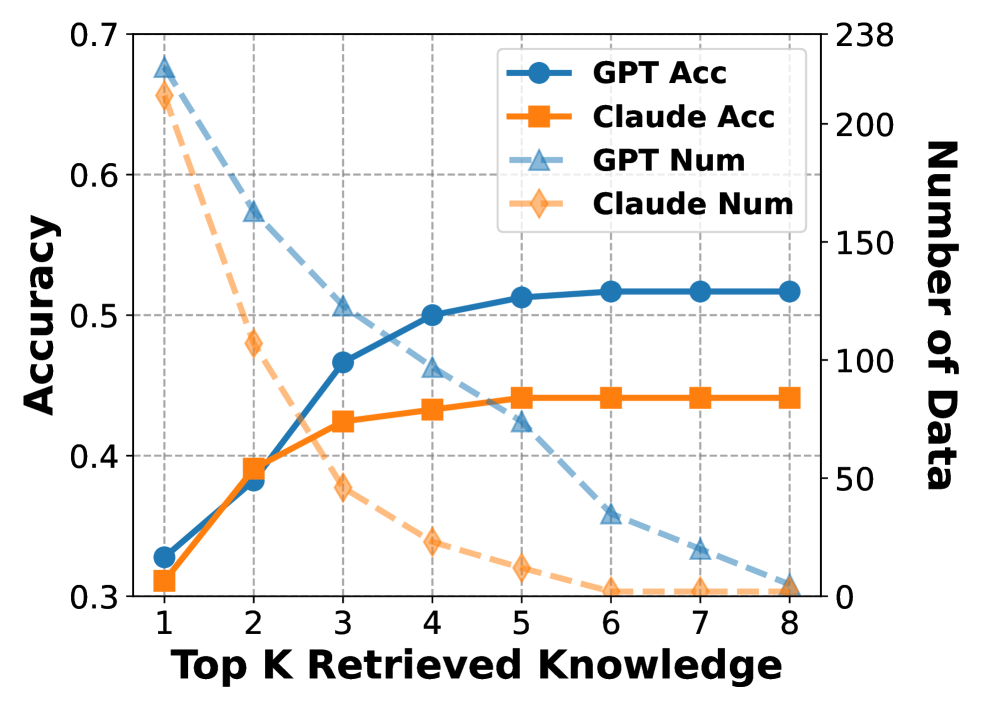
This line chart displays the relationship between the number of retrieved knowledge items (Top K Retrieved Knowledge) and both the accuracy and the number of data points for two models: GPT and Claude. Accuracy is measured on the left y-axis, while the number of data points is measured on the right y-axis. The chart shows how accuracy and data count change as the amount of retrieved knowledge increases from 1 to 8.
### Components/Axes
* **X-axis:** "Top K Retrieved Knowledge" ranging from 1 to 8.
* **Left Y-axis:** "Accuracy" ranging from 0.3 to 0.7.
* **Right Y-axis:** "Number of Data" ranging from 0 to 238.
* **Legend:** Located in the top-left corner, containing the following lines:
* "GPT Acc" (Blue, solid line with circle markers)
* "Claude Acc" (Orange, dashed line with square markers)
* "GPT Num" (Blue, dashed line with triangle markers)
* "Claude Num" (Orange, dotted line with diamond markers)
### Detailed Analysis
**GPT Accuracy ("GPT Acc" - Blue, solid line):**
The line starts at approximately 0.31 at K=1, rises sharply to around 0.48 at K=3, continues to increase to approximately 0.53 at K=5, and plateaus around 0.54 for K=6, 7, and 8.
**Claude Accuracy ("Claude Acc" - Orange, dashed line):**
The line begins at approximately 0.33 at K=1, increases rapidly to around 0.44 at K=3, and then rises more slowly to approximately 0.47 at K=8.
**GPT Number of Data Points ("GPT Num" - Blue, dashed line):**
The line starts at approximately 225 at K=1, decreases sharply to around 100 at K=4, and continues to decrease to approximately 25 at K=8.
**Claude Number of Data Points ("Claude Num" - Orange, dotted line):**
The line begins at approximately 238 at K=1, decreases rapidly to around 110 at K=4, and continues to decrease to approximately 30 at K=8.
### Key Observations
* GPT consistently demonstrates higher accuracy than Claude across all values of K.
* Both models exhibit a diminishing return in accuracy as K increases beyond 3.
* The number of data points decreases significantly as K increases for both models. This suggests that as more knowledge is retrieved, the data becomes more selective or filtered.
* The initial drop in data points is very steep for both models, indicating a substantial reduction in the dataset size with each additional retrieved knowledge item.
### Interpretation
The chart suggests that retrieving a small amount of knowledge (K=3) provides the most significant improvement in accuracy for both GPT and Claude. Beyond this point, the gains in accuracy are minimal, while the number of data points available decreases substantially. This could indicate that the most relevant information is retrieved early on, and adding more knowledge introduces noise or irrelevant data that diminishes the overall performance. The difference in accuracy between GPT and Claude suggests that GPT is better at utilizing retrieved knowledge to improve its performance, or that the retrieval mechanism itself is more effective for GPT. The steep decline in the number of data points as K increases could be due to a filtering process that prioritizes the most relevant knowledge items, or it could be a consequence of the retrieval algorithm itself. The chart highlights a trade-off between accuracy and data availability – increasing K improves accuracy up to a point, but at the cost of reducing the amount of data used for evaluation.