## Line Chart: Rouge-L vs. Tree Width
### Overview
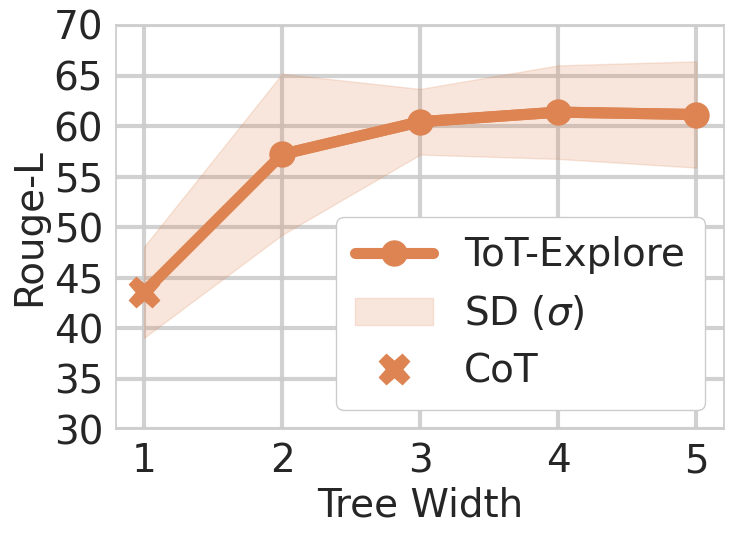
The image is a line chart comparing the performance of two methods, "ToT-Explore" and "CoT," based on their Rouge-L scores across different tree widths. The chart also displays the standard deviation (SD) for the "ToT-Explore" method.
### Components/Axes
* **X-axis (Horizontal):** "Tree Width" with values 1, 2, 3, 4, and 5.
* **Y-axis (Vertical):** "Rouge-L" ranging from 30 to 70, with increments of 5.
* **Legend (Right Side):**
* **ToT-Explore:** Solid orange line with circular markers.
* **SD (σ):** Shaded orange area around the "ToT-Explore" line, representing the standard deviation.
* **CoT:** Orange "x" markers.
### Detailed Analysis
* **ToT-Explore (Orange Line):**
* At Tree Width 1, Rouge-L is approximately 43.
* At Tree Width 2, Rouge-L is approximately 58.
* At Tree Width 3, Rouge-L is approximately 61.
* At Tree Width 4, Rouge-L is approximately 62.
* At Tree Width 5, Rouge-L is approximately 61.
* Trend: The Rouge-L score increases sharply from Tree Width 1 to 2, then increases more gradually from 2 to 4, and slightly decreases from 4 to 5.
* **SD (σ) - Shaded Orange Area:** The shaded area around the "ToT-Explore" line indicates the standard deviation. The width of the shaded area varies, suggesting different levels of variability at different tree widths. The standard deviation appears to be largest around Tree Width 2 and decreases as the Tree Width increases.
* **CoT (Orange "x" Markers):**
* At Tree Width 1, Rouge-L is approximately 43.
* Trend: Only one data point is provided for CoT.
### Key Observations
* The "ToT-Explore" method generally outperforms "CoT" (at Tree Width 1).
* The "ToT-Explore" method shows diminishing returns as the tree width increases beyond 2.
* The standard deviation for "ToT-Explore" is relatively high, especially at lower tree widths.
### Interpretation
The chart suggests that increasing the tree width for the "ToT-Explore" method initially leads to a significant improvement in the Rouge-L score. However, the gains diminish as the tree width increases further, and there is a slight decrease at a tree width of 5. The standard deviation indicates that the performance of "ToT-Explore" can vary, particularly at lower tree widths. The single data point for "CoT" shows that at a tree width of 1, it performs similarly to "ToT-Explore". The data implies that "ToT-Explore" is more effective than "CoT" at higher tree widths, but more data points for "CoT" would be needed to confirm this.