\n
## Line Chart: Rouge-L Score vs. Tree Width
### Overview
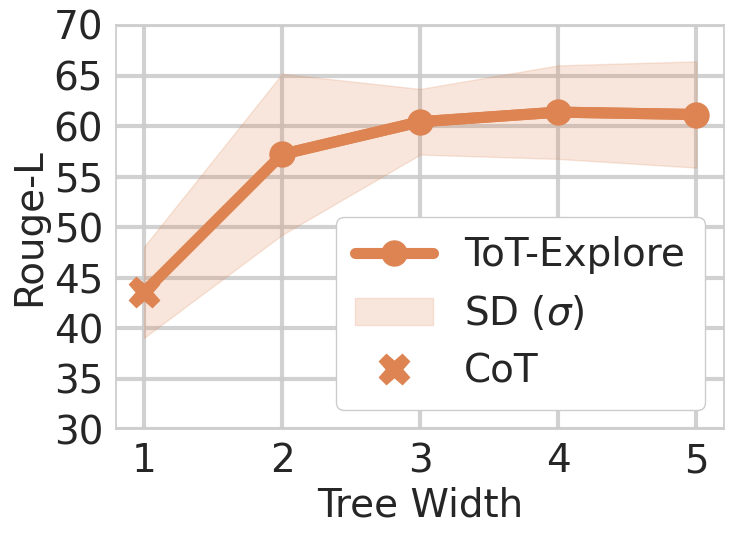
This image presents a line chart illustrating the relationship between Tree Width (on the x-axis) and Rouge-L score (on the y-axis) for different models: ToT-Explore, CoT, and the standard deviation (SD) around ToT-Explore. The chart aims to demonstrate how performance, as measured by Rouge-L, changes with varying tree widths.
### Components/Axes
* **X-axis:** "Tree Width" with values ranging from 1 to 5.
* **Y-axis:** "Rouge-L" with values ranging from 30 to 70.
* **Data Series:**
* "ToT-Explore" (represented by a solid orange line with circular markers).
* "SD (σ)" (represented by a shaded peach-colored area).
* "CoT" (represented by black 'x' markers).
* **Legend:** Located in the top-right corner of the chart.
### Detailed Analysis
* **ToT-Explore:** The line representing ToT-Explore starts at approximately 42 when Tree Width is 1. It then increases sharply to around 58 at Tree Width 2, continues to rise more gradually to approximately 62 at Tree Width 3, plateaus around 61 at Tree Width 4, and slightly decreases to approximately 61 at Tree Width 5.
* **SD (σ):** The shaded area representing the standard deviation is centered around the ToT-Explore line. It starts at approximately 58 at Tree Width 1, rises to around 64 at Tree Width 2, remains relatively stable between 63 and 65 from Tree Width 2 to 5.
* **CoT:** The CoT data points are consistently around 63, regardless of the Tree Width. Specifically:
* Tree Width 1: Approximately 63
* Tree Width 2: Approximately 63
* Tree Width 3: Approximately 63
* Tree Width 4: Approximately 63
* Tree Width 5: Approximately 63
### Key Observations
* ToT-Explore shows significant improvement in Rouge-L score as Tree Width increases from 1 to 2, but the gains diminish with further increases in Tree Width.
* The standard deviation (SD) around ToT-Explore remains relatively consistent across all Tree Widths, indicating stable performance.
* CoT maintains a constant Rouge-L score of approximately 63 across all Tree Widths.
* ToT-Explore outperforms CoT at Tree Width 1 and 2, but the performance gap narrows as Tree Width increases.
### Interpretation
The data suggests that increasing the Tree Width initially leads to substantial improvements in the performance of the ToT-Explore model, as measured by the Rouge-L score. However, beyond a certain point (around Tree Width 2), the benefits of increasing Tree Width diminish. The consistent performance of CoT indicates that its performance is not significantly affected by changes in Tree Width. The relatively stable standard deviation around ToT-Explore suggests that the model's performance is reliable and consistent across different Tree Widths. The initial rapid increase in ToT-Explore's score could be due to the model's ability to explore a wider range of possibilities with larger Tree Widths, but the diminishing returns may indicate that the model reaches a point of saturation where further increases in Tree Width do not lead to significant improvements. The fact that CoT remains constant suggests it may not benefit from the same exploration capabilities as ToT-Explore.