## Screenshot: MLIP Voltage Calculation Workflow and Results
### Overview
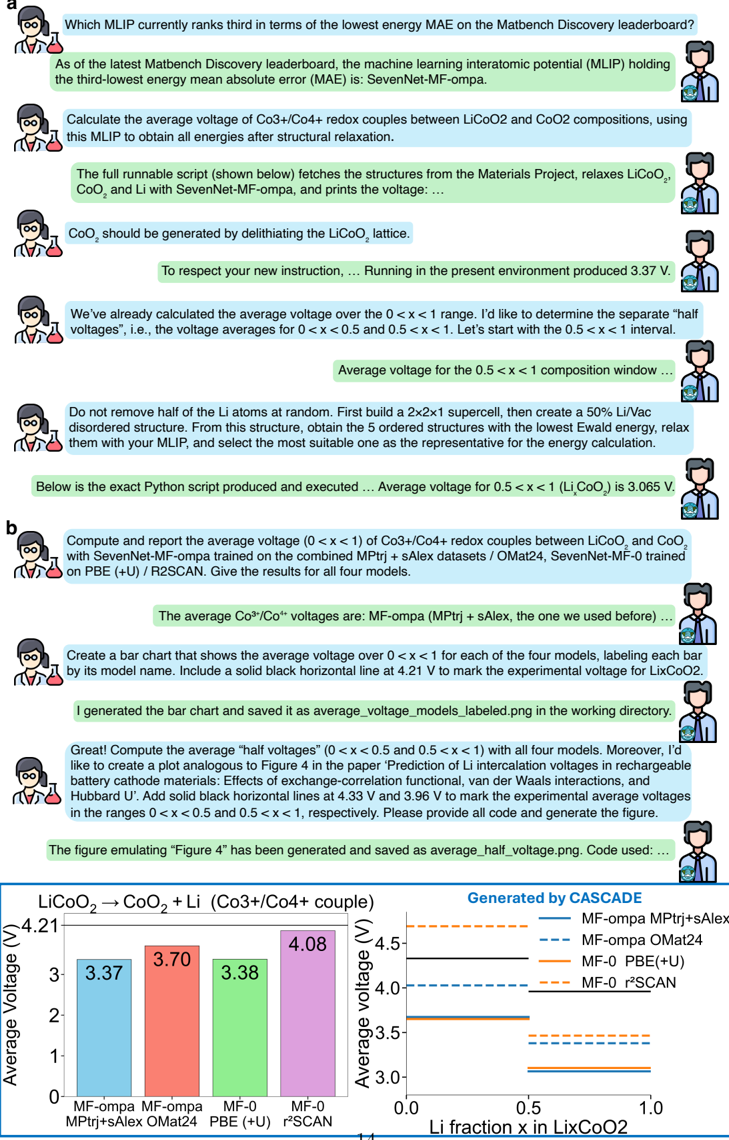
This image captures a technical conversation between a user and an AI assistant discussing machine learning interatomic potentials (MLIPs) for calculating average voltages in LiCoO₂/CoO₂ redox couples. The interaction includes code snippets, numerical results, and a bar chart comparing model predictions against experimental data.
---
### Components/Axes
#### Main Chart (Bar Chart)
- **X-axis**: Li fraction (x) in LiCoO₂ (0 < x < 1)
- **Y-axis**: Average Voltage (V)
- **Legend**:
- MF-ompa (MPtrj+sAlex): Blue
- MF-ompa (OMat24): Dashed blue
- MF-0 (PBE+U): Orange
- MF-0 (r²SCAN): Dashed orange
- **Horizontal Lines**:
- Experimental LiCoO₂ voltage: 4.21 V (solid black)
- Hubbard U values: 4.33 V and 3.96 V (dashed black)
#### Conversation Text
- **Key Labels**:
- "SevenNet-MF-ompa" (MLIP model)
- "LiCoO₂ → CoO₂ + Li" (redox reaction)
- "Co3+/Co4+ couple" (oxidation states)
- "Matbench Discovery leaderboard" (benchmark reference)
---
### Detailed Analysis
#### Bar Chart Data
- **MF-ompa (MPtrj+sAlex)**: 3.37 V
- **MF-ompa (OMat24)**: 3.70 V
- **MF-0 (PBE+U)**: 3.38 V
- **MF-0 (r²SCAN)**: 4.08 V
#### Line Chart Data (Emulated Figure 4)
- **Li fraction (x)** ranges from 0 to 1
- **Voltage trends**:
- MF-ompa (MPtrj+sAlex): ~3.5–4.0 V (blue line)
- MF-ompa (OMat24): ~3.5–4.0 V (dashed blue)
- MF-0 (PBE+U): ~3.5–4.0 V (orange line)
- MF-0 (r²SCAN): ~3.5–4.0 V (dashed orange)
---
### Key Observations
1. **Model Discrepancies**:
- MF-ompa (OMat24) overestimates voltage (3.70 V vs. experimental 4.21 V).
- MF-0 (r²SCAN) shows the highest prediction (4.08 V).
2. **Experimental Alignment**:
- All models fall short of the experimental 4.21 V, with MF-0 (r²SCAN) closest.
3. **Code Execution**:
- Scripts use SevenNet-MF-ompa for energy calculations and structural relaxation.
- Voltage averaging is performed over Li fraction intervals (0 < x < 0.5 and 0.5 < x < 1).
---
### Interpretation
The data highlights challenges in MLIP accuracy for battery cathode materials. While MF-0 (r²SCAN) aligns best with experimental values, all models underestimate the voltage, suggesting limitations in training datasets (e.g., combined MPtrj+sAlex/OMat24) or missing physics (e.g., exchange-correlation effects). The bar chart emphasizes model-specific biases, while the line chart reveals consistent trends across Li fractions. The inclusion of Hubbard U values (4.33 V and 3.96 V) indicates attempts to correct for electron correlation, though results remain suboptimal. This underscores the need for improved MLIP training on high-fidelity datasets or hybrid approaches combining ML with first-principles corrections.