# Technical Document Extraction: GPU Throughput Analysis
## Chart Overview
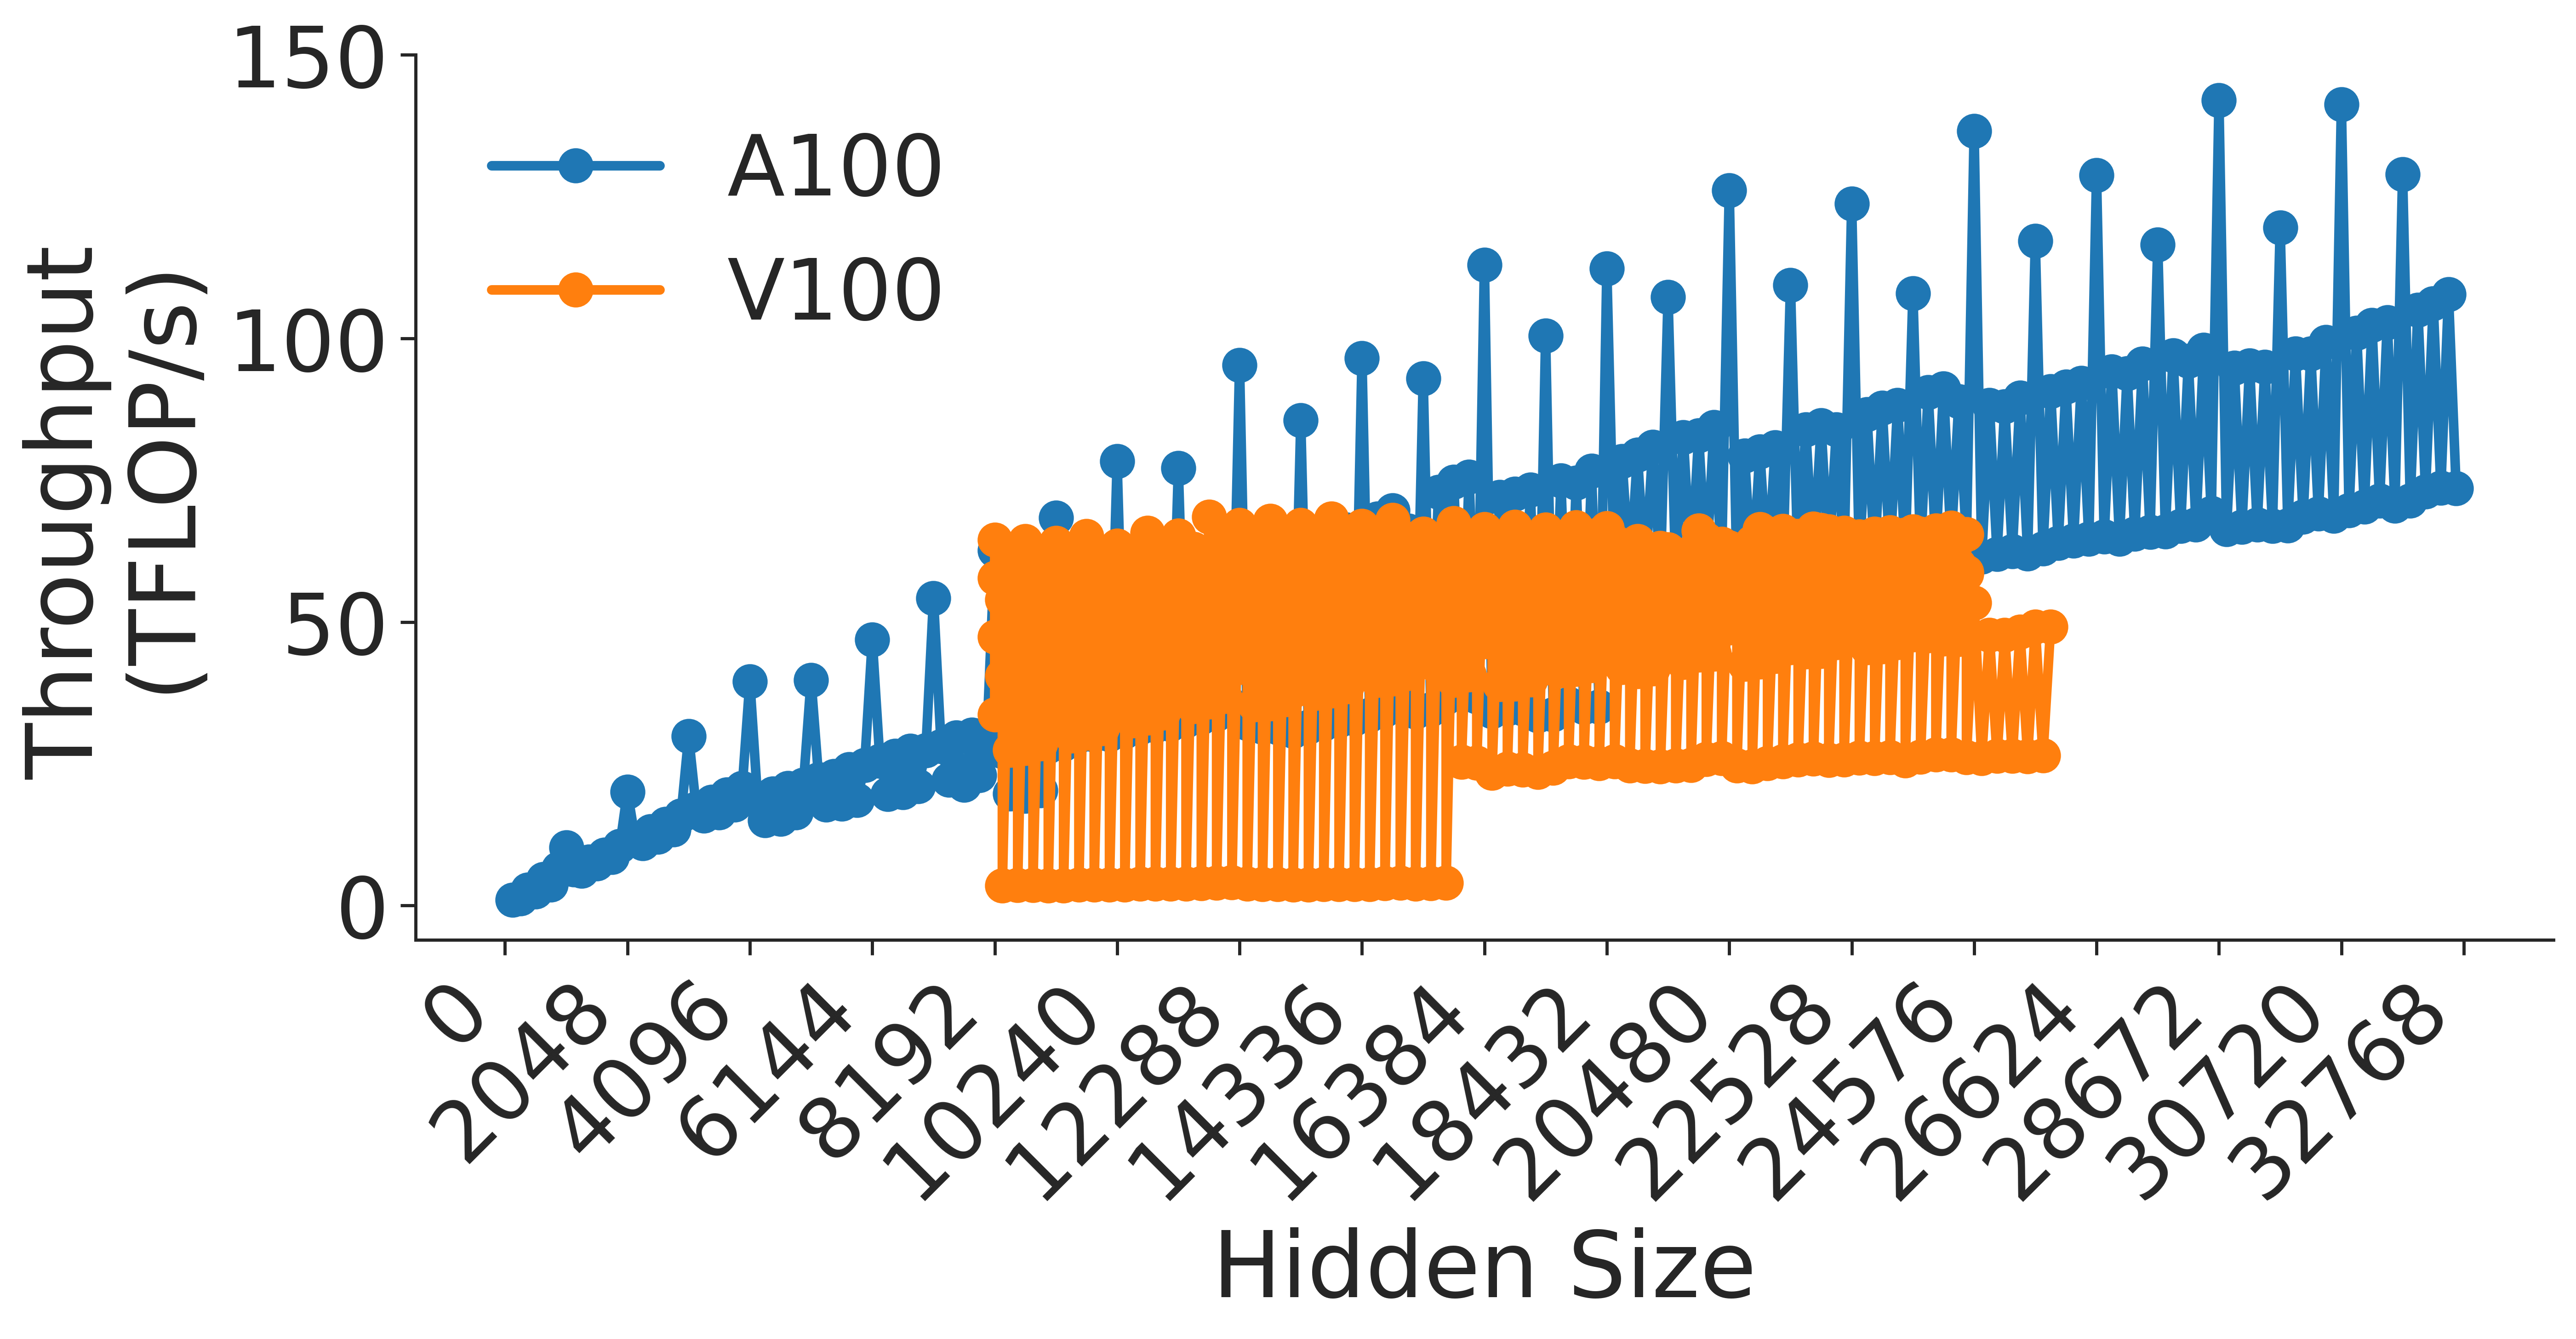
The image presents a line chart comparing the computational throughput (in TFLOPs/s) of two GPU architectures (A100 and V100) across varying hidden sizes. The chart emphasizes performance scaling behavior relative to model complexity (hidden size).
---
## Axis Labels & Scales
- **X-axis (Hidden Size)**:
- Range: 0 to 32,768
- Increment: Logarithmic scale (powers of 2: 2048, 4096, 8192, ..., 32768)
- **Y-axis (Throughput (TFLOPs/s))**:
- Range: 0 to 150
- Increment: Linear scale (0, 50, 100, 150)
---
## Legend & Data Series
- **Legend Position**: Top-right quadrant
- **Color Coding**:
- **Blue (A100)**: Higher-end GPU architecture
- **Orange (V100)**: Legacy GPU architecture
---
## Key Trends & Data Points
### A100 (Blue Line)
- **Trend**: Consistent upward slope with minimal variance
- **Performance Progression**:
- 2048: ~10 TFLOPs/s
- 4096: ~20 TFLOPs/s
- 8192: ~35 TFLOPs/s
- 16384: ~70 TFLOPs/s
- 32768: ~120 TFLOPs/s
- **Error Bars**: Small vertical error bars (≤5% of throughput value)
### V100 (Orange Line)
- **Trend**: Bimodal pattern with peak at mid-range hidden sizes
- **Performance Progression**:
- 2048: ~20 TFLOPs/s
- 4096: ~30 TFLOPs/s
- 8192: ~50 TFLOPs/s
- 16384: ~60 TFLOPs/s (peak)
- 32768: ~40 TFLOPs/s (decline)
- **Error Bars**: Larger variance at higher hidden sizes (10-15% of throughput)
---
## Critical Observations
1. **Scaling Efficiency**:
- A100 maintains linear scaling up to 32,768 hidden size
- V100 exhibits diminishing returns beyond 16,384 hidden size
2. **Performance Gap**:
- At 32,768 hidden size:
- A100: 120 TFLOPs/s
- V100: 40 TFLOPs/s
- **Gap**: 3x performance difference
3. **Practical Implications**:
- A100 enables larger model training (e.g., 32k hidden size models)
- V100 becomes throughput-limited at mid-range model sizes
---
## Data Integrity Verification
- **Color Consistency**: All blue data points match A100 legend; all orange match V100
- **Axis Alignment**: All data points fall within axis ranges
- **Trend Logic**: Visual slopes match numerical progression (e.g., A100's 10→120 TFLOPs/s over 2048→32768 hidden size)
---
## Missing Elements
- No secondary y-axis or annotations
- No gridlines or reference markers
- No temporal or experimental condition metadata
---
## Conclusion
The chart demonstrates A100's superior scaling efficiency compared to V100, with throughput increasing proportionally to hidden size up to 32,768. V100's performance plateaus at mid-range model complexities, making it unsuitable for modern large-scale AI workloads.