## Heatmap: Cosine Similarity of Keys and Values Before and After Alignment
### Overview
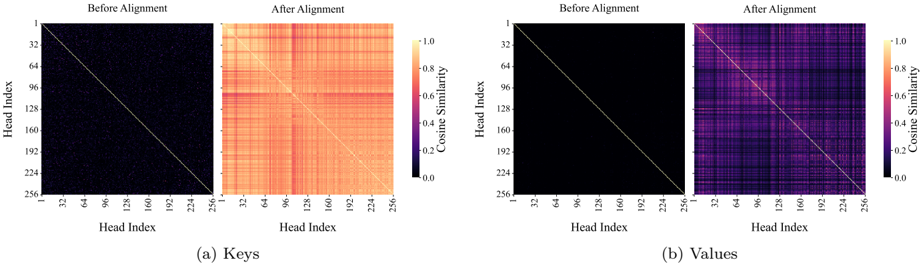
This image presents a comparative analysis of cosine similarity matrices for two components of a neural network architecture (likely Multi-Head Attention mechanisms): "Keys" (a) and "Values" (b). Each section compares the state of the model "Before Alignment" and "After Alignment." The heatmaps visualize the similarity between 256 distinct attention heads.
### Components/Axes
* **Axes:** Both the X and Y axes represent "Head Index," ranging from 1 to 256.
* **Tick Markers:** 1, 32, 64, 96, 128, 160, 192, 224, 256.
* **Legends:**
* **Panel (a) Keys:** A vertical color bar on the right of the "After Alignment" plot. Scale ranges from 0.0 (black) to 1.0 (light yellow). Label: "Cosine Similarity".
* **Panel (b) Values:** A vertical color bar on the right of the "After Alignment" plot. Scale ranges from 0.0 (black) to 1.0 (light yellow). Label: "Cosine Similarity".
* **Layout:**
* **Panel (a) Keys:** Two heatmaps side-by-side. Left: "Before Alignment"; Right: "After Alignment".
* **Panel (b) Values:** Two heatmaps side-by-side. Left: "Before Alignment"; Right: "After Alignment".
### Detailed Analysis
#### Panel (a) Keys
* **Before Alignment:** The heatmap is almost entirely black, indicating that the cosine similarity between different heads is near 0.0. A very faint, thin diagonal line is visible, representing the self-similarity of each head (which is 1.0).
* **After Alignment:** There is a dramatic shift in the color distribution. The heatmap is populated with varying shades of orange and yellow, indicating a significant increase in cosine similarity between heads.
* **Trend:** The similarity is not uniform; it exhibits a block-like structure, suggesting that specific groups of heads have become highly similar to one another.
* **Values:** The diagonal remains bright (1.0). Off-diagonal regions show values ranging roughly from 0.2 to 0.8, with some clusters appearing quite bright (yellow).
#### Panel (b) Values
* **Before Alignment:** Similar to the Keys, the heatmap is almost entirely black, indicating near-zero cosine similarity between heads, with only the self-similarity diagonal visible.
* **After Alignment:** There is a noticeable increase in similarity compared to the "Before" state, but the intensity is lower than that observed in the Keys.
* **Trend:** The colors are predominantly purple and dark magenta, indicating moderate cosine similarity (roughly 0.2 to 0.4).
* **Values:** The diagonal remains bright (1.0). The off-diagonal regions show a grid-like pattern of increased similarity, but the overall magnitude is lower than in the Keys panel.
### Key Observations
* **Alignment Effect:** The alignment process successfully increases the cosine similarity between heads for both Keys and Values.
* **Magnitude Difference:** The "Keys" alignment results in higher overall cosine similarity (lighter, more yellow/orange colors) compared to the "Values" alignment (darker, purple/magenta colors).
* **Structural Patterns:** Both "After Alignment" plots show a non-uniform, blocky structure. This suggests that the alignment process does not make all heads identical, but rather encourages clusters of heads to align with each other.
* **Baseline:** The "Before Alignment" state for both Keys and Values is essentially sparse/orthogonal, meaning the heads are largely uncorrelated prior to the alignment intervention.
### Interpretation
This data demonstrates the effect of a head-alignment or head-merging technique in a Transformer-based model.
* **What the data demonstrates:** The alignment process is effective at forcing the attention heads to converge toward similar representations.
* **Why it matters:** In Transformer models, attention heads are often redundant. By aligning them, researchers can potentially prune the model, reduce computational overhead, or distill knowledge from a larger model into a smaller one without significant performance loss.
* **Reading between the lines:** The fact that Keys align more strongly than Values suggests that the alignment mechanism might be prioritizing the Key projections. This could imply that the "Keys" are the primary locus of the learned attention patterns, while "Values" are more flexible or require less strict alignment to maintain model performance. The blocky patterns in the "After" plots suggest that the heads are being grouped into functional clusters rather than being forced into a single uniform state.