## Network Diagram: Original vs. Sparsified Graph & Neighbor Distribution
### Overview
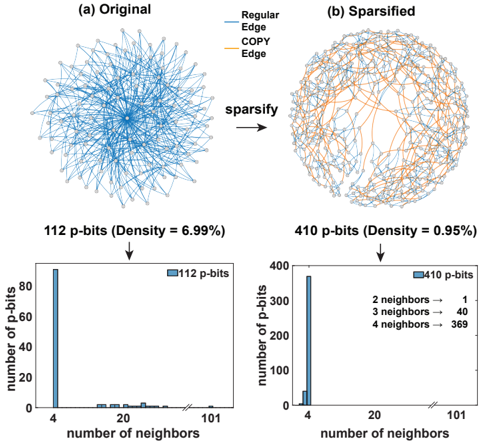
The image presents a comparison between an original network graph and a sparsified version, along with histograms illustrating the distribution of the number of neighbors for each graph. The diagrams demonstrate the effect of a "sparsify" operation on network density and neighbor connectivity.
### Components/Axes
* **Diagram (a): Original** - A network graph with nodes arranged roughly in a circular pattern.
* **Diagram (b): Sparsified** - A network graph, also with nodes arranged roughly in a circular pattern, but with fewer edges.
* **Arrow:** A labeled arrow between diagrams (a) and (b) indicating the transformation "sparsify".
* **Histogram 1:** Distribution of the number of neighbors for the 112 p-bits graph.
* X-axis: "number of neighbors" (scale from 0 to 101, approximately).
* Y-axis: "number of p-bits" (scale from 0 to 80, approximately).
* **Histogram 2:** Distribution of the number of neighbors for the 410 p-bits graph.
* X-axis: "number of neighbors" (scale from 0 to 101, approximately).
* Y-axis: "number of p-bits" (scale from 0 to 400, approximately).
* **Legend (Diagrams a & b):**
* Blue Line: "Regular Edge"
* Orange Line: "COPY Edge"
* **Text Labels:**
* "112 p-bits (Density = 6.99%)" - positioned above Histogram 1.
* "410 p-bits (Density = 0.95%)" - positioned above Histogram 2.
* **Legend (Histogram 2):**
* "2 neighbors -> 1"
* "3 neighbors -> 40"
* "4 neighbors -> 369"
### Detailed Analysis or Content Details
**Diagram (a) - Original:**
The original graph appears densely connected. The nodes are arranged in a circular fashion, with many edges radiating from the center and connecting neighboring nodes. The edges are predominantly blue ("Regular Edge"), with a smaller number of orange edges ("COPY Edge"). The density is reported as 6.99%.
**Diagram (b) - Sparsified:**
The sparsified graph exhibits significantly fewer edges than the original. While the nodes maintain a similar circular arrangement, the connections are much sparser. The density is reported as 0.95%. The proportion of orange ("COPY Edge") edges appears higher in the sparsified graph compared to the original.
**Histogram 1 (112 p-bits):**
The histogram shows a strong peak at a low number of neighbors (approximately 4). The number of p-bits decreases rapidly as the number of neighbors increases.
* Approximately 75 p-bits have 4 neighbors.
* The number of p-bits with 20 or more neighbors is very low (less than 5).
**Histogram 2 (410 p-bits):**
This histogram also shows a strong peak, but at a higher number of neighbors (approximately 4). The distribution is more spread out than the first histogram.
* Approximately 370 p-bits have 4 neighbors.
* Approximately 40 p-bits have 3 neighbors.
* Only 1 p-bit has 2 neighbors.
* The number of p-bits with 20 or more neighbors is very low (less than 10).
### Key Observations
* The "sparsify" operation drastically reduces the density of the network.
* The sparsification process appears to preserve a core set of connections (around 4 neighbors per node), while removing many other edges.
* The proportion of "COPY Edge" connections seems to increase after sparsification.
* The distribution of neighbors shifts towards lower values after sparsification.
### Interpretation
The data suggests that the "sparsify" operation is designed to reduce the complexity of the network while maintaining a minimal level of connectivity. The decrease in density from 6.99% to 0.95% indicates a substantial reduction in the number of edges. The histograms reveal that the sparsification process primarily removes nodes with a high degree (many neighbors), leaving a core network with a relatively low degree. The increase in the proportion of "COPY Edge" connections could indicate that these edges are prioritized during the sparsification process, perhaps representing important or critical connections within the network. The overall effect is a more efficient and less redundant network structure. The data suggests a deliberate attempt to prune the network, potentially for computational efficiency or to highlight specific connections.