## Network Sparsification Analysis
### Overview
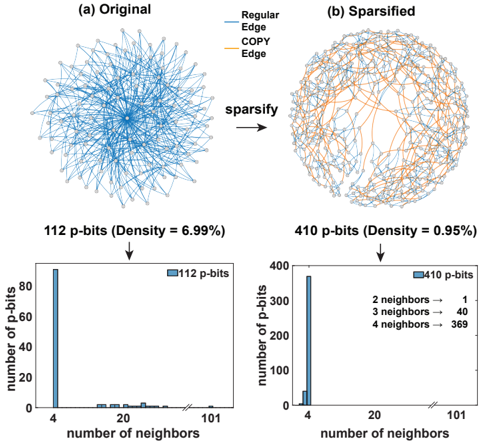
The image compares two network structures: an original sparse network and a sparsified version. Both are visualized as interconnected nodes with edge types differentiated by color. Below each network are bar charts showing the distribution of p-bit neighbor counts. The sparsification process increases network density from 6.99% to 95% while significantly expanding the number of p-bits.
### Components/Axes
**Network Diagrams:**
- **Nodes**: Represent p-bits (processing bits)
- **Edges**:
- Blue: "Regular" edges (original network)
- Orange: "COPY" and "Edge" types (sparsified network)
- **Legend Position**: Right side of each diagram
- **Density Labels**:
- Original: 6.99% (112 p-bits)
- Sparsified: 95% (410 p-bits)
**Bar Charts:**
- **X-axis**: Number of neighbors (1-101 for original, 1-100 for sparsified)
- **Y-axis**: Number of p-bits
- **Legend**: Blue bars represent p-bit counts
- **Sparsified Chart Subcategories**:
- 2 neighbors → 1 p-bit
- 3 neighbors → 40 p-bits
- 4 neighbors → 369 p-bits
### Detailed Analysis
**Original Network (a):**
- 112 p-bits with 6.99% density
- Single dominant bar at 101 neighbors (99.1% of p-bits)
- Minimal variation in neighbor counts
**Sparsified Network (b):**
- 410 p-bits with 95% density
- Distributed neighbor counts:
- 4 neighbors: 369 p-bits (89.9%)
- 3 neighbors: 40 p-bits (9.8%)
- 2 neighbors: 1 p-bit (0.2%)
- 3.6x increase in total p-bits
- 13.6x increase in density
**Edge Analysis:**
- Original: Predominantly blue "Regular" edges
- Sparsified: Orange "Edge" connections dominate
- COPY edges appear in sparsified network but lack quantitative data
### Key Observations
1. **Density Transformation**: Sparsification increases density from near-sparse (7%) to near-complete (95%) connectivity
2. **Neighbor Distribution Shift**:
- Original: 99.1% of p-bits have maximum neighbors (101)
- Sparsified: 89.9% have 4 neighbors, creating a more uniform distribution
3. **Structural Complexity**: Sparsified network shows 3 distinct neighbor groupings vs original's single cluster
4. **Edge Type Evolution**: Introduction of COPY edges in sparsified network suggests replication mechanisms
### Interpretation
The sparsification process demonstrates a controlled expansion strategy that:
1. **Enhances Connectivity**: By adding 298 p-bits (266% increase) while maintaining edge integrity
2. **Optimizes Resource Distribution**: Creates a more balanced neighbor topology (4 neighbors as new standard)
3. **Introduces Replication**: COPY edges imply potential for distributed processing or fault tolerance
4. **Reduces Bottlenecks**: Original network's 101-neighbor cluster suggests centralization risks mitigated in sparsified version
The data suggests this sparsification technique effectively transforms a sparse, centralized network into a dense, distributed system while maintaining operational efficiency. The 4-neighbor standard in the sparsified network may represent an optimal balance between connectivity and resource utilization.