## 3D Surface Plot: True ∞ - FE vs. x'1 and x'2
### Overview
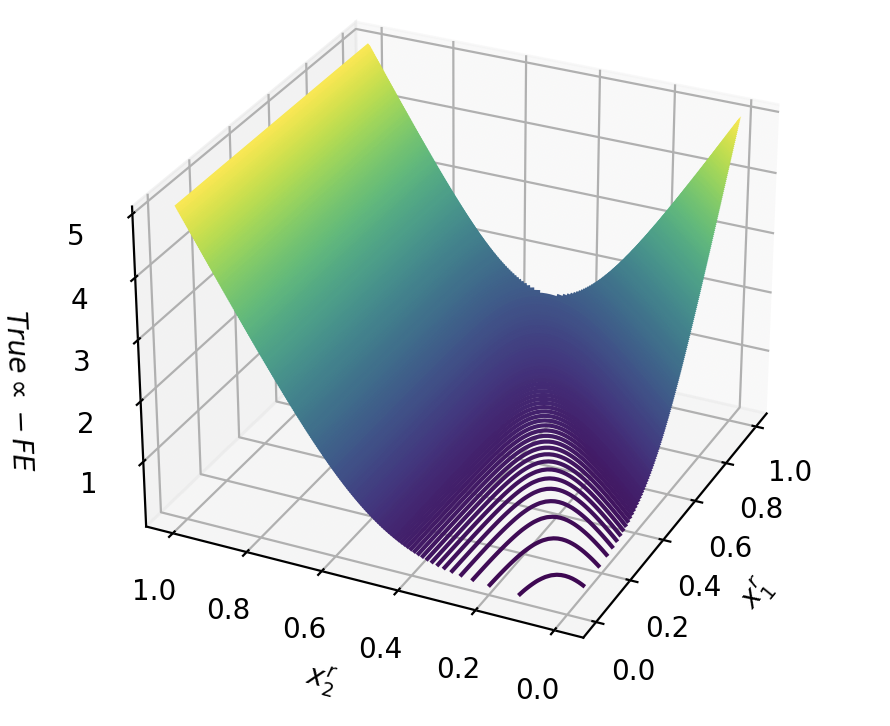
The image is a 3D surface plot visualizing the relationship between two variables, x'1 and x'2, and a dependent variable represented as "True ∞ - FE". The surface is colored according to its height, ranging from dark purple at the lowest points to yellow at the highest. Contour lines are projected onto the x'1-x'2 plane.
### Components/Axes
* **X-axis (x'1):** Ranges from 0.0 to 1.0 in increments of 0.2.
* **Y-axis (x'2):** Ranges from 0.0 to 1.0 in increments of 0.2.
* **Z-axis (True ∞ - FE):** Ranges from 1 to 5 in increments of 1.
* **Surface Color:** Indicates the value of "True ∞ - FE", with purple representing lower values and yellow representing higher values.
### Detailed Analysis
* **Surface Trend:** The surface forms a valley, with the lowest point located near the origin (x'1 = 0, x'2 = 0). The surface slopes upwards as x'1 and x'2 increase.
* **Contour Lines:** The contour lines are concentrated near the origin, indicating a steeper slope in that region. The contour lines are approximately concentric and elliptical.
### Key Observations
* The minimum value of "True ∞ - FE" occurs when both x'1 and x'2 are close to 0.
* The value of "True ∞ - FE" increases as x'1 and x'2 move away from 0.
* The rate of increase is higher near the origin.
### Interpretation
The plot suggests that the value represented by "True ∞ - FE" is minimized when x'1 and x'2 are both small. This could represent an error or cost function that is minimized under certain conditions. The shape of the surface indicates that the relationship between "True ∞ - FE" and x'1 and x'2 is non-linear. The concentration of contour lines near the origin suggests that small changes in x'1 and x'2 have a larger impact on "True ∞ - FE" when x'1 and x'2 are close to 0.