\n
## 3D Surface Plot: True α - FE
### Overview
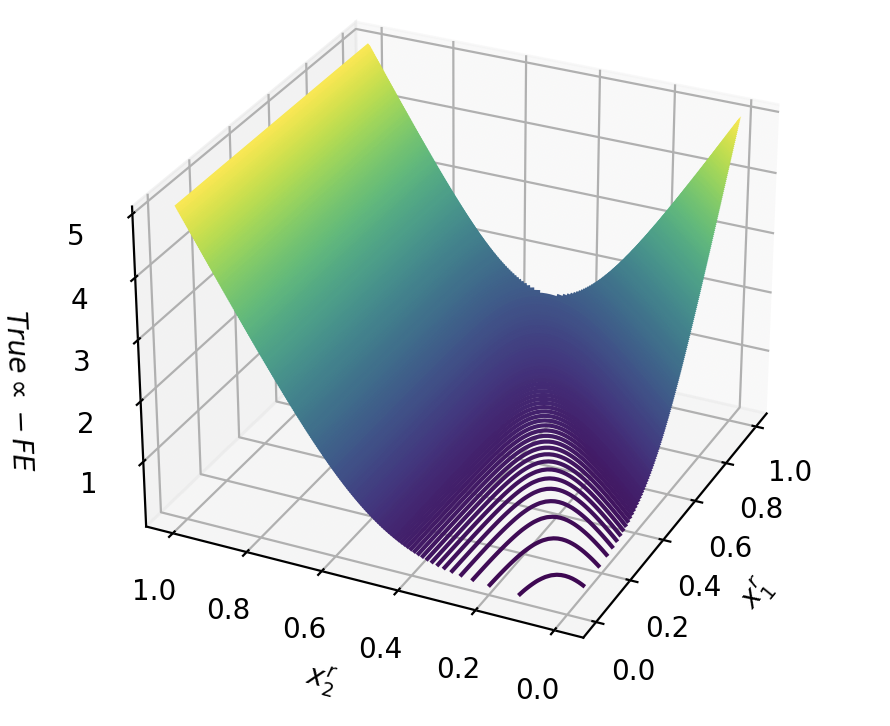
The image presents a 3D surface plot visualizing the relationship between three variables: `x₁`, `x₂`, and `True α - FE`. The surface is colored, indicating varying values of `True α - FE`. The plot appears to represent a function of two input variables (`x₁` and `x₂`) resulting in a single output variable (`True α - FE`).
### Components/Axes
* **X-axis:** `x₁`, ranging from approximately 0.0 to 1.0.
* **Y-axis:** `x₂`, ranging from approximately 0.0 to 1.0.
* **Z-axis:** `True α - FE`, ranging from approximately 0.0 to 5.0.
* **Surface:** The colored surface represents the values of `True α - FE` for different combinations of `x₁` and `x₂`.
* **Color Gradient:** The color of the surface varies from purple (low values of `True α - FE`) to green/yellow (high values of `True α - FE`).
### Detailed Analysis
The surface exhibits a distinct "valley" shape.
* **Trend:** The surface slopes downward from both the `x₁` = 0.0 and `x₁` = 1.0 edges towards a minimum value around `x₁` = 0.5. Similarly, it slopes downward from both the `x₂` = 0.0 and `x₂` = 1.0 edges towards a minimum value around `x₂` = 0.5.
* **Minimum:** The minimum value of `True α - FE` appears to be approximately 0.8, located near the center of the plot (x₁ ≈ 0.5, x₂ ≈ 0.5).
* **Maximum:** The maximum values of `True α - FE` are located along the edges of the plot, particularly at the corners. The maximum value appears to be around 5.0, occurring at (x₁ ≈ 0.0, x₂ ≈ 0.0), (x₁ ≈ 1.0, x₂ ≈ 0.0), (x₁ ≈ 0.0, x₂ ≈ 1.0), and (x₁ ≈ 1.0, x₂ ≈ 1.0).
* **Contour Lines:** There are numerous contour lines visible on the surface, particularly in the valley region. These lines indicate constant values of `True α - FE`. The lines are densely packed near the minimum, indicating a steep gradient, and more spaced out towards the edges, indicating a shallower gradient.
### Key Observations
* The surface is symmetrical with respect to both `x₁` and `x₂`.
* The function `True α - FE` is minimized when both `x₁` and `x₂` are approximately 0.5.
* The function `True α - FE` increases rapidly as `x₁` and `x₂` move away from 0.5.
### Interpretation
The plot suggests a relationship where `True α - FE` is inversely proportional to the distance from the point (0.5, 0.5) in the `x₁`-`x₂` plane. This could represent a scenario where an optimal value for `True α - FE` is achieved when `x₁` and `x₂` are balanced around a central point. The shape of the surface indicates a strong sensitivity of `True α - FE` to changes in `x₁` and `x₂` when they are close to the optimal values. The function likely represents some form of error or difference, where the minimum value indicates the best fit or lowest error. Without further context, it's difficult to determine the specific meaning of the variables, but the plot clearly demonstrates a well-defined minimum and a symmetrical relationship between the input and output variables.