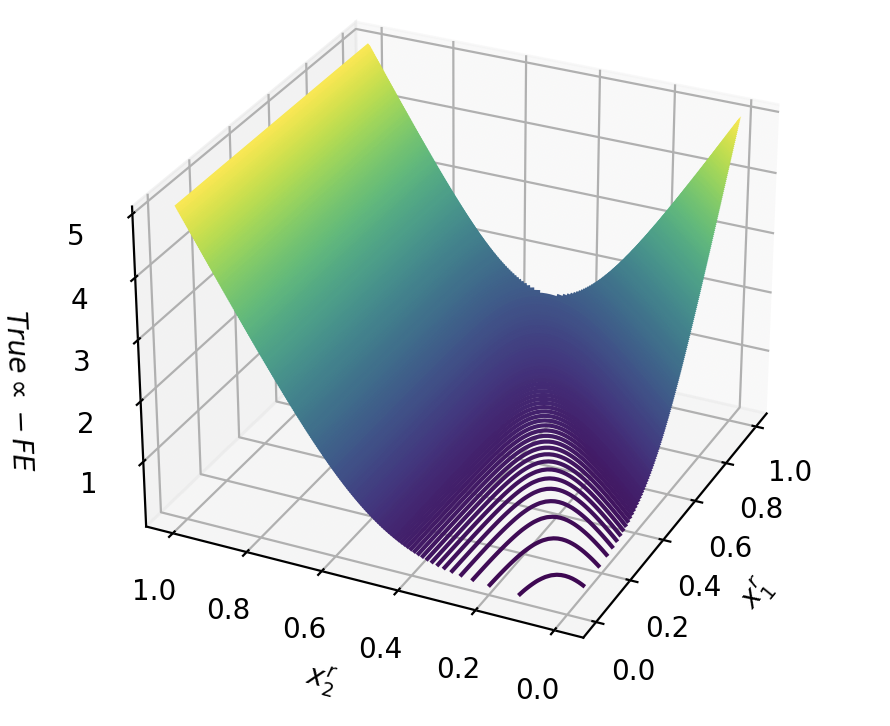
## 3D Surface Plot: True α - FE vs. x₁' and x₂'
### Overview
The image displays a three-dimensional surface plot. The plot visualizes a continuous, saddle-shaped surface defined over a square domain in the x₁' and x₂' plane. The surface's height (z-axis) is represented by both vertical position and a color gradient, ranging from deep purple at the lowest points to bright yellow at the highest points.
### Components/Axes
* **X-axis (Right):** Labeled `x₁'`. The scale runs from `0.0` to `1.0` with major tick marks at intervals of 0.2 (0.0, 0.2, 0.4, 0.6, 0.8, 1.0).
* **Y-axis (Left):** Labeled `x₂'`. The scale runs from `0.0` to `1.0` with major tick marks at intervals of 0.2 (0.0, 0.2, 0.4, 0.6, 0.8, 1.0).
* **Z-axis (Vertical):** Labeled `True α - FE`. The scale runs from `1` to `5` with major tick marks at integer intervals (1, 2, 3, 4, 5).
* **Color Mapping:** The surface color corresponds to the z-axis value (`True α - FE`). The gradient transitions from dark purple (lowest values, ~1) through teal and green to bright yellow (highest values, ~5). This acts as an implicit legend for the z-axis.
* **Grid:** A light gray wireframe grid is present on the three back planes (x-z, y-z, and x-y) to aid in spatial orientation.
### Detailed Analysis
* **Surface Shape:** The surface forms a classic saddle or hyperbolic paraboloid shape. It has a minimum along the diagonal where `x₁' ≈ x₂'`. As one moves away from this diagonal towards the corners where `x₁'` and `x₂'` are most different (e.g., (1.0, 0.0) or (0.0, 1.0)), the surface rises steeply.
* **Data Trends & Values:**
* **Minimum Region:** The lowest values of `True α - FE` (approaching 1, indicated by dark purple) are found along the line where `x₁' = x₂'`. For example, at the point `(x₁'=0.5, x₂'=0.5)`, the surface is at its lowest.
* **Maximum Regions:** The highest values (approaching 5, indicated by bright yellow) occur at the two opposite corners of the domain: `(x₁'=1.0, x₂'=0.0)` and `(x₁'=0.0, x₂'=1.0)`.
* **Symmetry:** The surface is symmetric about the `x₁' = x₂'` diagonal. The value at `(a, b)` appears equal to the value at `(b, a)`.
* **Contour Lines:** At the base of the plot (on the x-y plane), a series of concentric, curved contour lines are visible. These lines represent curves of constant `True α - FE` value projected onto the domain. They are densest near the center diagonal, indicating a steep gradient, and become more spaced out towards the corners.
### Key Observations
1. **Saddle Point Topology:** The defining feature is the saddle shape, indicating that the function `True α - FE = f(x₁', x₂')` has a minimax property. It is minimized along one direction (the diagonal) and maximized along the orthogonal direction.
2. **Strong Diagonal Dependence:** The value of `True α - FE` is primarily determined by the *difference* between `x₁'` and `x₂'`. When they are equal, the value is low; when they are maximally different, the value is high.
3. **Color-Value Correlation:** The color gradient provides an immediate, intuitive reading of the z-axis magnitude, reinforcing the spatial understanding of the surface's height.
### Interpretation
This plot likely represents the behavior of a function or metric (`True α - FE`) that depends on two normalized parameters (`x₁'` and `x₂'`). The data suggests a fundamental trade-off or interaction:
* **Optimal Condition:** The system or phenomenon being modeled achieves its lowest `True α - FE` state when the two parameters are balanced or equal (`x₁' = x₂'`). This could represent a point of equilibrium, fairness, or minimal error.
* **Penalty for Imbalance:** Any deviation from this balance, where one parameter becomes larger than the other, results in a penalty measured by an increase in `True α - FE`. The penalty grows more severe as the imbalance increases.
* **Symmetry Implication:** The symmetry indicates that the roles of `x₁'` and `x₂'` are interchangeable in their effect on the output. The system does not favor one parameter over the other.
* **Potential Context:** Without specific domain knowledge, this pattern is common in optimization landscapes (showing a valley along a constraint), in fairness metrics (where disparity increases the score), or in models of competition/symbiosis where deviation from a balanced state is costly. The "True α - FE" label suggests it might be a corrected or fundamental version of a metric (α) minus some effect (FE).