## Scatter Plot: LLM Performance Across Datasets
### Overview
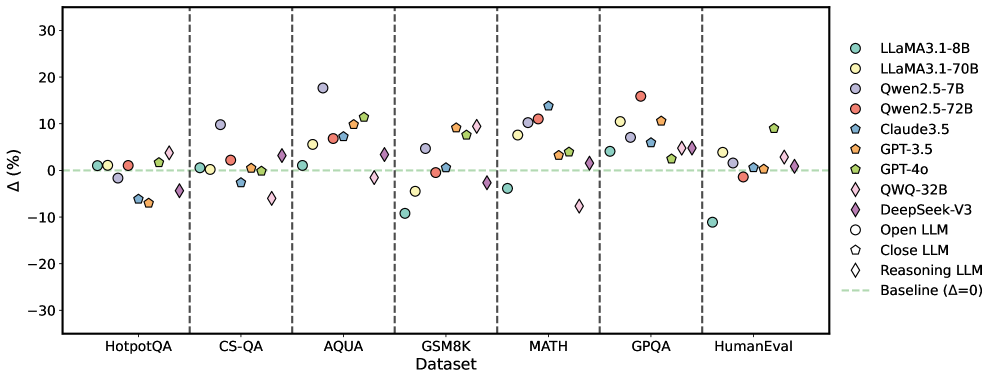
The image is a scatter plot comparing the performance of various Large Language Models (LLMs) across different datasets. The y-axis represents the percentage difference (Δ (%)), and the x-axis represents the datasets. Each LLM is represented by a unique color and marker shape, as indicated in the legend on the right. A baseline at Δ = 0 is shown as a dashed green line.
### Components/Axes
* **X-axis:** "Dataset" with categories: HotpotQA, CS-QA, AQUA, GSM8K, MATH, GPQA, HumanEval.
* **Y-axis:** "Δ (%)" ranging from -30 to 30 with tick marks at -30, -20, -10, 0, 10, 20, and 30.
* **Legend (Right side):**
* Light Green Circle: LLAMA3.1-8B
* Yellow Circle: LLAMA3.1-70B
* Light Purple Circle: Qwen2.5-7B
* Red Circle: Qwen2.5-72B
* Teal Pentagon: Claude3.5
* Orange Pentagon: GPT-3.5
* Light Green Pentagon: GPT-4o
* Light Blue Diamond: QWQ-32B
* Dark Purple Diamond: DeepSeek-V3
* White Circle: Open LLM
* Gray Pentagon: Close LLM
* White Diamond: Reasoning LLM
* Dashed Light Green Line: Baseline (Δ=0)
### Detailed Analysis
Here's a breakdown of the approximate performance of each model on each dataset:
* **HotpotQA:**
* LLAMA3.1-8B (Light Green Circle): ~1%
* LLAMA3.1-70B (Yellow Circle): ~1%
* Qwen2.5-7B (Light Purple Circle): ~1%
* Qwen2.5-72B (Red Circle): ~1%
* Claude3.5 (Teal Pentagon): ~1%
* GPT-3.5 (Orange Pentagon): ~-7%
* GPT-4o (Light Green Pentagon): ~2%
* QWQ-32B (Light Blue Diamond): ~-7%
* DeepSeek-V3 (Dark Purple Diamond): ~-5%
* Open LLM (White Circle): ~1%
* Close LLM (Gray Pentagon): ~-6%
* Reasoning LLM (White Diamond): ~-2%
* **CS-QA:**
* LLAMA3.1-8B (Light Green Circle): ~-2%
* LLAMA3.1-70B (Yellow Circle): ~1%
* Qwen2.5-7B (Light Purple Circle): ~-1%
* Qwen2.5-72B (Red Circle): ~2%
* Claude3.5 (Teal Pentagon): ~-1%
* GPT-3.5 (Orange Pentagon): ~-6%
* GPT-4o (Light Green Pentagon): ~1%
* QWQ-32B (Light Blue Diamond): ~-10%
* DeepSeek-V3 (Dark Purple Diamond): ~-4%
* Open LLM (White Circle): ~-2%
* Close LLM (Gray Pentagon): ~-7%
* Reasoning LLM (White Diamond): ~2%
* **AQUA:**
* LLAMA3.1-8B (Light Green Circle): ~10%
* LLAMA3.1-70B (Yellow Circle): ~17%
* Qwen2.5-7B (Light Purple Circle): ~4%
* Qwen2.5-72B (Red Circle): ~11%
* Claude3.5 (Teal Pentagon): ~12%
* GPT-3.5 (Orange Pentagon): ~8%
* GPT-4o (Light Green Pentagon): ~10%
* QWQ-32B (Light Blue Diamond): ~-1%
* DeepSeek-V3 (Dark Purple Diamond): ~5%
* Open LLM (White Circle): ~18%
* Close LLM (Gray Pentagon): ~13%
* Reasoning LLM (White Diamond): ~2%
* **GSM8K:**
* LLAMA3.1-8B (Light Green Circle): ~-8%
* LLAMA3.1-70B (Yellow Circle): ~1%
* Qwen2.5-7B (Light Purple Circle): ~2%
* Qwen2.5-72B (Red Circle): ~9%
* Claude3.5 (Teal Pentagon): ~1%
* GPT-3.5 (Orange Pentagon): ~1%
* GPT-4o (Light Green Pentagon): ~10%
* QWQ-32B (Light Blue Diamond): ~-1%
* DeepSeek-V3 (Dark Purple Diamond): ~-4%
* Open LLM (White Circle): ~-8%
* Close LLM (Gray Pentagon): ~-2%
* Reasoning LLM (White Diamond): ~2%
* **MATH:**
* LLAMA3.1-8B (Light Green Circle): ~1%
* LLAMA3.1-70B (Yellow Circle): ~11%
* Qwen2.5-7B (Light Purple Circle): ~4%
* Qwen2.5-72B (Red Circle): ~11%
* Claude3.5 (Teal Pentagon): ~11%
* GPT-3.5 (Orange Pentagon): ~7%
* GPT-4o (Light Green Pentagon): ~9%
* QWQ-32B (Light Blue Diamond): ~-1%
* DeepSeek-V3 (Dark Purple Diamond): ~-5%
* Open LLM (White Circle): ~1%
* Close LLM (Gray Pentagon): ~-1%
* Reasoning LLM (White Diamond): ~2%
* **GPQA:**
* LLAMA3.1-8B (Light Green Circle): ~-11%
* LLAMA3.1-70B (Yellow Circle): ~6%
* Qwen2.5-7B (Light Purple Circle): ~4%
* Qwen2.5-72B (Red Circle): ~15%
* Claude3.5 (Teal Pentagon): ~4%
* GPT-3.5 (Orange Pentagon): ~11%
* GPT-4o (Light Green Pentagon): ~10%
* QWQ-32B (Light Blue Diamond): ~-1%
* DeepSeek-V3 (Dark Purple Diamond): ~-5%
* Open LLM (White Circle): ~-1%
* Close LLM (Gray Pentagon): ~-2%
* Reasoning LLM (White Diamond): ~2%
* **HumanEval:**
* LLAMA3.1-8B (Light Green Circle): ~1%
* LLAMA3.1-70B (Yellow Circle): ~2%
* Qwen2.5-7B (Light Purple Circle): ~1%
* Qwen2.5-72B (Red Circle): ~5%
* Claude3.5 (Teal Pentagon): ~-2%
* GPT-3.5 (Orange Pentagon): ~-3%
* GPT-4o (Light Green Pentagon): ~1%
* QWQ-32B (Light Blue Diamond): ~-11%
* DeepSeek-V3 (Dark Purple Diamond): ~2%
* Open LLM (White Circle): ~1%
* Close LLM (Gray Pentagon): ~-2%
* Reasoning LLM (White Diamond): ~2%
### Key Observations
* The performance of the LLMs varies significantly across different datasets.
* Some models consistently outperform others on specific datasets.
* There is a noticeable spread in performance, indicating that no single model is universally superior.
* The "Reasoning LLM" (White Diamond) consistently hovers around the baseline (Δ=0) across all datasets.
* GPT-3.5 (Orange Pentagon) tends to underperform compared to other models, often showing negative Δ values.
* QWQ-32B (Light Blue Diamond) shows significant underperformance on CS-QA and HumanEval.
* LLAMA3.1-70B (Yellow Circle) and Qwen2.5-72B (Red Circle) often achieve higher Δ values compared to other models, particularly on AQUA, MATH, and GPQA datasets.
### Interpretation
The scatter plot provides a comparative analysis of various LLMs across a range of datasets, highlighting their strengths and weaknesses. The data suggests that the choice of LLM should be tailored to the specific task or dataset, as performance varies significantly. The consistent performance of the "Reasoning LLM" near the baseline might indicate a more general-purpose model, while others are optimized for specific types of questions or data. The underperformance of GPT-3.5 on several datasets is a notable outlier, suggesting potential limitations in its architecture or training data. The superior performance of LLAMA3.1-70B and Qwen2.5-72B on certain datasets indicates their potential suitability for tasks involving those specific types of data or reasoning. The plot underscores the importance of benchmarking LLMs on diverse datasets to gain a comprehensive understanding of their capabilities.