\n
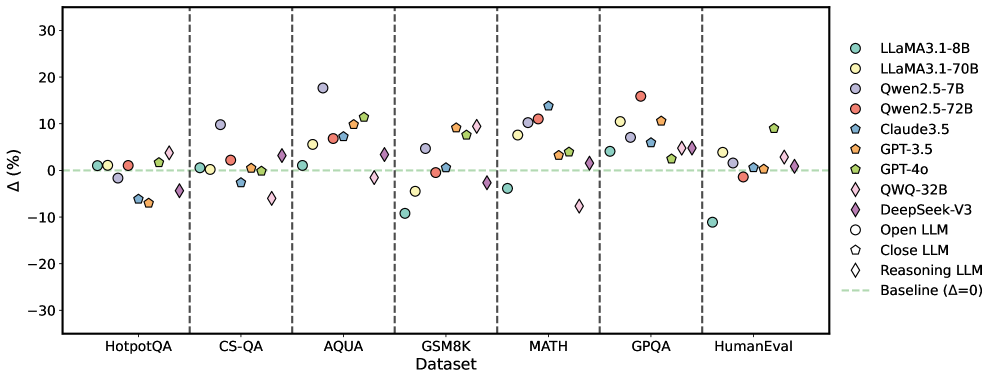
## Scatter Plot: Performance Comparison of Large Language Models
### Overview
This image presents a scatter plot comparing the performance of various Large Language Models (LLMs) across seven different datasets. The y-axis represents the performance difference (Δ) in percentage points relative to a baseline, while the x-axis lists the datasets used for evaluation. Each LLM is represented by a unique marker and color. Vertical dashed lines separate the datasets.
### Components/Axes
* **X-axis:** Dataset - with the following categories: HotpotQA, CS-QA, AQUA, GSM8K, MATH, GPQA, HumanEval.
* **Y-axis:** Δ (%) - Performance difference in percentage points. The scale ranges from approximately -30% to 30%.
* **Legend:** Located in the top-right corner, identifying each LLM with a corresponding color and marker shape. The legend includes:
* LLaMA3.1-8B (Light Blue Circle)
* LLaMA3.1-70B (Light Orange Circle)
* Qwen.2.5-7B (Light Grey Circle)
* Qwen.2.5-72B (Red Circle)
* Claude3.5 (Dark Blue Triangle)
* GPT-3.5 (Dark Orange Triangle)
* GPT-4o (Dark Purple Diamond)
* QWQ-32B (Pink Diamond)
* DeepSeek-V3 (Purple Hexagon)
* Open LLM (Grey Hexagon)
* Close LLM (Light Green Hexagon)
* Reasoning LLM (Black Diamond)
* Baseline (Δ=0) - Horizontal dashed line.
### Detailed Analysis
The plot shows the performance variation of each LLM across the datasets. The baseline is represented by a horizontal dashed line at Δ=0.
* **HotpotQA:** Most models cluster around the baseline (0%), with some variation. LLaMA3.1-8B shows a slight negative difference (approximately -2%), while Qwen.2.5-72B shows a slight positive difference (approximately +2%).
* **CS-QA:** Performance differences are more pronounced. GPT-4o shows the highest positive difference (approximately +10%), while Qwen.2.5-7B shows a negative difference (approximately -5%).
* **AQUA:** GPT-4o exhibits a significant positive difference (approximately +20%), while Qwen.2.5-7B shows a negative difference (approximately -10%).
* **GSM8K:** GPT-4o continues to show a strong positive difference (approximately +15%), while Qwen.2.5-7B remains negative (approximately -10%).
* **MATH:** GPT-4o shows the highest positive difference (approximately +25%), while Qwen.2.5-7B shows a negative difference (approximately -15%).
* **GPQA:** Performance is more varied. GPT-4o shows a positive difference (approximately +10%), while DeepSeek-V3 shows a negative difference (approximately -10%).
* **HumanEval:** Models are relatively close to the baseline. GPT-4o shows a slight positive difference (approximately +5%), while Qwen.2.5-7B shows a slight negative difference (approximately -2%).
**Specific Data Points (Approximate):**
* **GPT-4o:** HotpotQA (+0%), CS-QA (+10%), AQUA (+20%), GSM8K (+15%), MATH (+25%), GPQA (+10%), HumanEval (+5%).
* **Qwen.2.5-7B:** HotpotQA (-2%), CS-QA (-5%), AQUA (-10%), GSM8K (-10%), MATH (-15%), GPQA (-5%), HumanEval (-2%).
* **LLaMA3.1-70B:** Generally shows positive, but smaller differences than GPT-4o.
### Key Observations
* GPT-4o consistently outperforms other models across most datasets, particularly on GSM8K, MATH, and AQUA.
* Qwen.2.5-7B consistently underperforms compared to the baseline across most datasets.
* The performance differences between models are most significant on datasets like MATH and AQUA, suggesting these datasets are more sensitive to model capabilities.
* The spread of data points within each dataset indicates varying performance levels among the LLMs.
### Interpretation
The data suggests that GPT-4o is a significantly more capable LLM than the others tested, especially in tasks requiring reasoning and mathematical abilities (as evidenced by its performance on GSM8K and MATH). The consistent negative performance of Qwen.2.5-7B indicates it may be less effective for these types of tasks. The varying performance across datasets highlights the importance of evaluating LLMs on a diverse range of benchmarks to get a comprehensive understanding of their capabilities. The clustering of points around the baseline in some datasets (e.g., HotpotQA) suggests that these tasks are relatively easy for most of the tested models. The large spread in performance on datasets like MATH suggests a greater degree of differentiation in model capabilities. The baseline (Δ=0) serves as a crucial reference point, allowing for a clear assessment of whether a model is performing better or worse than a standard level.