## Scatter Plot: Model Performance Comparison Across Datasets
### Overview
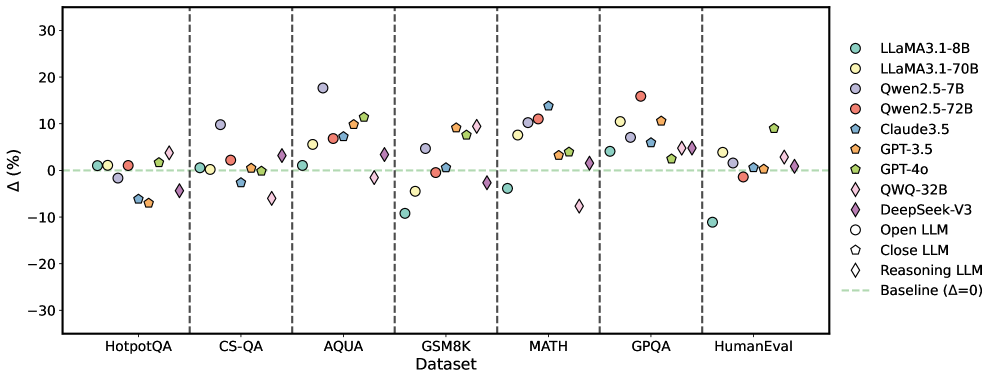
The image is a scatter plot comparing the performance change (Δ%) of various large language models (LLMs) across seven benchmark datasets. The plot uses color-coded markers to represent different models, with a baseline (Δ=0) indicated by a dashed green line.
### Components/Axes
- **X-axis (Dataset)**: Categorical axis with seven benchmark datasets:
- HotpotQA
- CS-QA
- AQUA
- GSM8K
- MATH
- GPQA
- HumanEval
Vertical dashed lines separate datasets.
- **Y-axis (Δ%)**: Numerical axis ranging from -30% to 30%, representing percentage change in performance.
- **Legend**: Located in the top-right corner, mapping colors/shapes to models:
- **Teal circles**: LLaMA3.1-8B
- **Yellow circles**: LLaMA3.1-70B
- **Purple circles**: Qwen2.5-7B
- **Red circles**: Qwen2.5-72B
- **Blue pentagons**: Claude3.5
- **Orange pentagons**: GPT-3.5
- **Green pentagons**: GPT-4o
- **Pink diamonds**: QWQ-32B
- **Purple diamonds**: DeepSeek-V3
- **Open circles**: Open LLM
- **Closed pentagons**: Close LLM
- **Diamond shapes**: Reasoning LLM
- **Dashed green line**: Baseline (Δ=0)
### Detailed Analysis
1. **Dataset Performance**:
- **HotpotQA**:
- LLaMA3.1-8B (teal) ≈ +2%
- GPT-3.5 (orange) ≈ -8%
- DeepSeek-V3 (purple diamond) ≈ -5%
- **CS-QA**:
- Qwen2.5-7B (purple) ≈ +12%
- GPT-4o (green pentagon) ≈ +3%
- **AQUA**:
- LLaMA3.1-70B (yellow) ≈ +18%
- Claude3.5 (blue pentagon) ≈ -2%
- **GSM8K**:
- Qwen2.5-72B (red) ≈ +15%
- GPT-4o (green pentagon) ≈ -10%
- **MATH**:
- QWQ-32B (pink diamond) ≈ +8%
- DeepSeek-V3 (purple diamond) ≈ -3%
- **GPQA**:
- LLaMA3.1-8B (teal) ≈ -5%
- GPT-3.5 (orange) ≈ +10%
- **HumanEval**:
- LLaMA3.1-8B (teal) ≈ -10%
- GPT-4o (green pentagon) ≈ +9%
2. **Trends**:
- **Positive Δ**: LLaMA3.1-70B (yellow) and GPT-4o (green pentagon) show consistent gains in multiple datasets (AQUA, GPQA, HumanEval).
- **Negative Δ**: LLaMA3.1-8B (teal) underperforms in HumanEval (-10%) and GPQA (-5%).
- **Mixed Results**: Reasoning LLMs (diamonds) show variability, with QWQ-32B (pink) performing well in MATH (+8%) but poorly in CS-QA (-12%).
### Key Observations
- **Outliers**:
- LLaMA3.1-70B (yellow) achieves the highest Δ (+18%) in AQUA.
- LLaMA3.1-8B (teal) has the largest negative Δ (-10%) in HumanEval.
- **Baseline Proximity**: Most models cluster near Δ=0, indicating minimal performance changes across datasets.
- **Model-Specific Patterns**:
- GPT-4o (green pentagon) shows strong gains in GPQA (+10%) and HumanEval (+9%).
- Qwen2.5-72B (red) performs well in GSM8K (+15%) but poorly in CS-QA (-7%).
### Interpretation
The data suggests that model performance is highly dataset-dependent. Larger models like LLaMA3.1-70B and GPT-4o demonstrate superior gains in reasoning-heavy tasks (AQUA, GPQA), while smaller models (LLaMA3.1-8B) struggle in code evaluation (HumanEval). The variability in Reasoning LLMs (diamonds) implies that reasoning capabilities may not generalize uniformly across tasks. Notably, the absence of extreme outliers (e.g., Δ > ±20%) suggests most models maintain relatively stable performance, with incremental improvements or declines. This highlights the importance of dataset-specific optimization for LLMs.