## Bar Chart: Agent Performance on Test Suite (95% CI)
### Overview
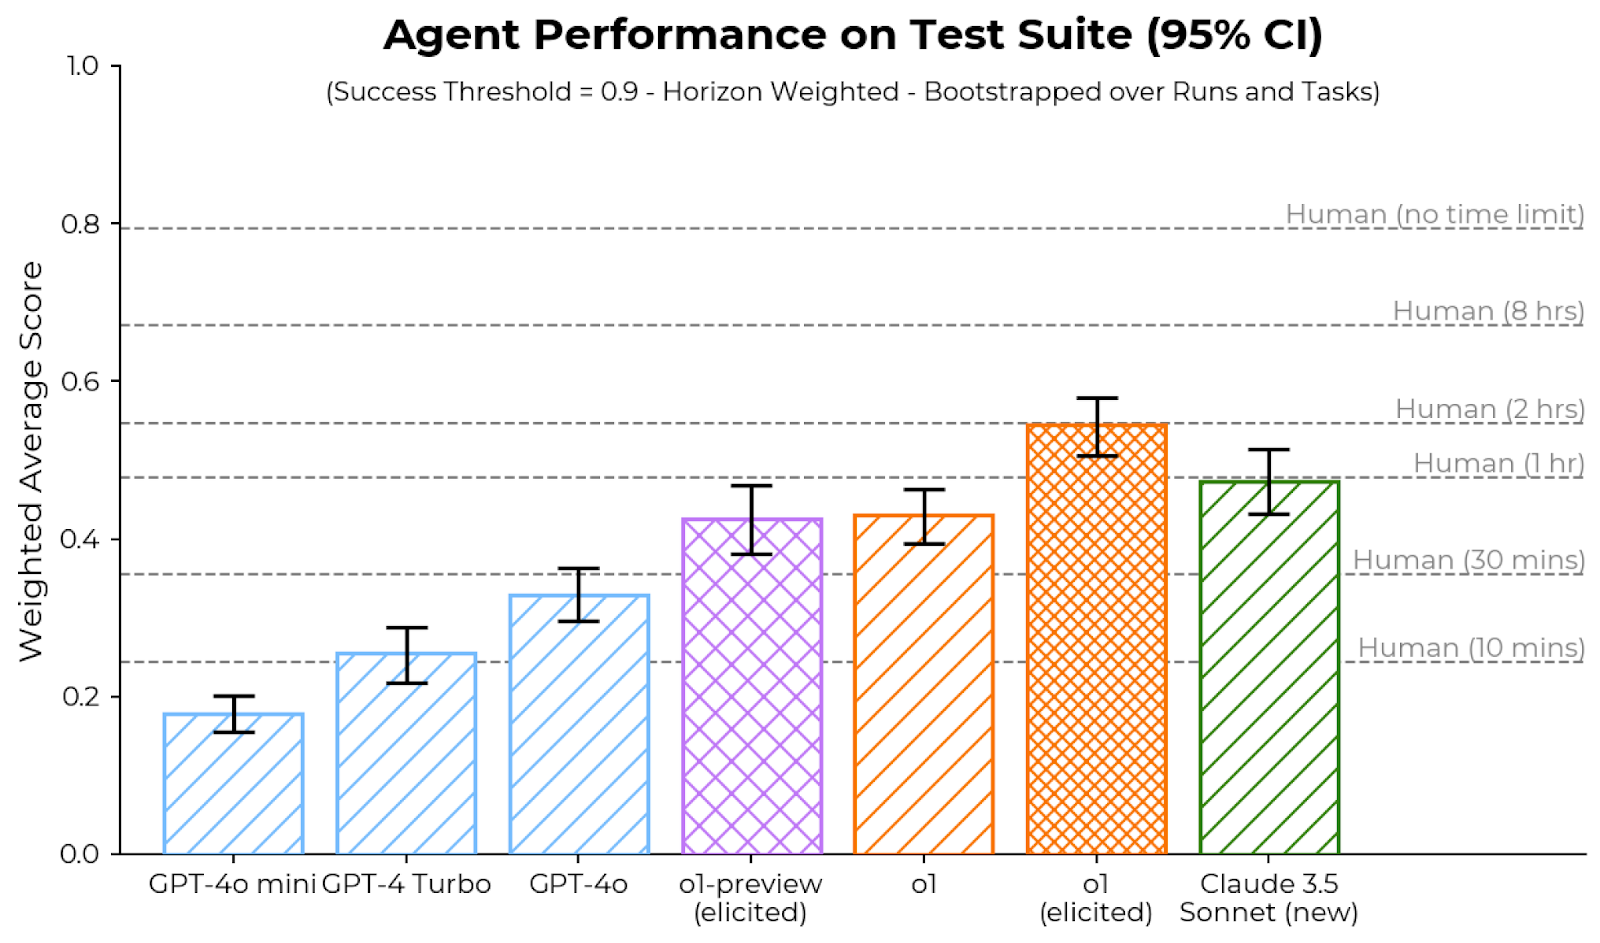
The image is a bar chart comparing the performance of different AI agents and humans on a test suite. The y-axis represents the weighted average score, and the x-axis represents the different agents and human benchmarks. Error bars indicate the 95% confidence interval. The chart also includes horizontal lines indicating human performance under different time constraints. The success threshold is 0.9, and the data is horizon-weighted and bootstrapped over runs and tasks.
### Components/Axes
* **Title:** Agent Performance on Test Suite (95% CI)
* **Subtitle:** (Success Threshold = 0.9 - Horizon Weighted - Bootstrapped over Runs and Tasks)
* **Y-axis:** Weighted Average Score, ranging from 0.0 to 1.0 in increments of 0.2.
* **X-axis:** AI Agents: GPT-4o mini, GPT-4 Turbo, GPT-4o, o1-preview (elicited), o1, o1 (elicited), Claude 3.5 Sonnet (new)
* **Horizontal Lines (Human Benchmarks):**
* Human (no time limit)
* Human (8 hrs)
* Human (2 hrs)
* Human (1 hr)
* Human (30 mins)
* Human (10 mins)
* **Error Bars:** Represent 95% Confidence Intervals for each agent.
### Detailed Analysis
* **GPT-4o mini:** Light blue bar with diagonal stripes, approximately 0.18 weighted average score.
* **GPT-4 Turbo:** Light blue bar with diagonal stripes, approximately 0.26 weighted average score.
* **GPT-4o:** Light blue bar with diagonal stripes, approximately 0.34 weighted average score.
* **o1-preview (elicited):** Light purple bar with cross-hatch pattern, approximately 0.43 weighted average score.
* **o1:** Orange bar with diagonal stripes, approximately 0.43 weighted average score.
* **o1 (elicited):** Orange bar with cross-hatch pattern, approximately 0.55 weighted average score.
* **Claude 3.5 Sonnet (new):** Green bar with diagonal stripes, approximately 0.48 weighted average score.
**Human Benchmarks:**
* Human (no time limit): Approximately 0.82
* Human (8 hrs): Approximately 0.72
* Human (2 hrs): Approximately 0.52
* Human (1 hr): Approximately 0.42
* Human (30 mins): Approximately 0.32
* Human (10 mins): Approximately 0.22
### Key Observations
* The "o1 (elicited)" agent has the highest weighted average score among the AI agents tested.
* The performance of the AI agents generally increases from "GPT-4o mini" to "o1 (elicited)".
* Human performance varies significantly depending on the time limit, with "Human (no time limit)" achieving the highest score.
* The error bars (confidence intervals) vary in size across the different agents, indicating different levels of uncertainty in their performance.
### Interpretation
The bar chart provides a comparison of the performance of different AI agents on a test suite, benchmarked against human performance under various time constraints. The data suggests that while some AI agents approach human-level performance under limited time conditions (e.g., "o1 (elicited)" compared to "Human (1 hr)"), they still fall short of human performance with no time limit. The confidence intervals provide insight into the reliability of the performance estimates for each agent. The "elicited" versions of "o1" appear to perform better than the non-elicited versions, suggesting that elicitation techniques may improve agent performance. The success threshold of 0.9 is not met by any of the AI agents, indicating room for improvement.