\n
## Bar Chart: Agent Performance on Test Suite (95% CI)
### Overview
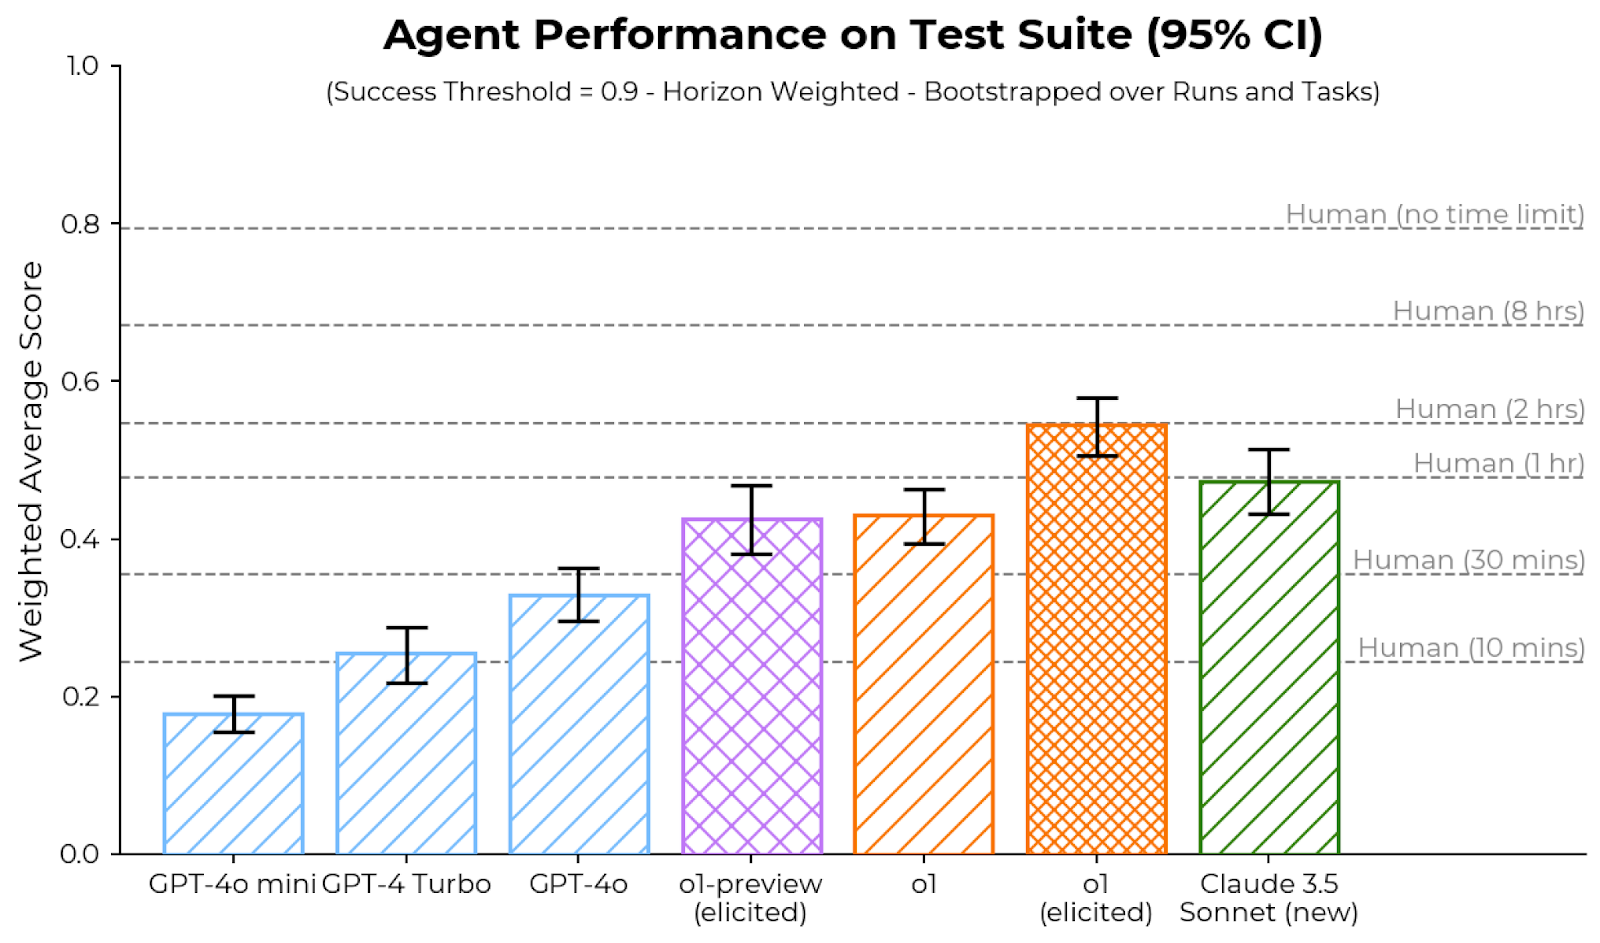
This bar chart compares the weighted average score of several agents (GPT-4o mini, GPT-4 Turbo, GPT-4o, ol-preview (elicited), ol (elicited), and Claude 3.5 Sonnet (new)) on a test suite. Error bars represent a 95% confidence interval. Horizontal lines indicate human performance at various time limits. The success threshold is 0.9, and the weighting is horizon weighted, bootstrapped over runs and tasks.
### Components/Axes
* **X-axis:** Agent Name (GPT-4o mini, GPT-4 Turbo, GPT-4o, ol-preview (elicited), ol (elicited), Claude 3.5 Sonnet (new))
* **Y-axis:** Weighted Average Score (Scale from 0.0 to 1.0, increments of 0.1)
* **Horizontal Lines:** Represent human performance at different time limits:
* Human (no time limit) at approximately 0.8
* Human (8 hrs) at approximately 0.7
* Human (2 hrs) at approximately 0.6
* Human (1 hr) at approximately 0.5
* Human (30 mins) at approximately 0.4
* Human (0 mins) at approximately 0.3
* **Error Bars:** Represent 95% confidence intervals for each agent's score.
* **Title:** "Agent Performance on Test Suite (95% CI)"
* **Subtitle:** "(Success Threshold = 0.9 - Horizon Weighted - Bootstrapped over Runs and Tasks)"
* **Bar Colors:**
* GPT-4o mini: Light Blue
* GPT-4 Turbo: Medium Blue
* GPT-4o: Dark Blue
* ol-preview (elicited): Orange-Yellow
* ol (elicited): Orange
* Claude 3.5 Sonnet (new): Green
### Detailed Analysis
* **GPT-4o mini:** The bar is centered around approximately 0.14. The error bar extends from roughly 0.08 to 0.20.
* **GPT-4 Turbo:** The bar is centered around approximately 0.26. The error bar extends from roughly 0.20 to 0.32.
* **GPT-4o:** The bar is centered around approximately 0.34. The error bar extends from roughly 0.28 to 0.40.
* **ol-preview (elicited):** The bar is centered around approximately 0.46. The error bar extends from roughly 0.40 to 0.52.
* **ol (elicited):** The bar is centered around approximately 0.45. The error bar extends from roughly 0.40 to 0.50.
* **Claude 3.5 Sonnet (new):** The bar is centered around approximately 0.52. The error bar extends from roughly 0.46 to 0.58.
All agents show increasing performance as you move from left to right on the x-axis. The error bars indicate varying degrees of uncertainty in the performance estimates.
### Key Observations
* Claude 3.5 Sonnet (new) exhibits the highest weighted average score, approaching the performance of humans with a 1-hour time limit.
* GPT-4o mini has the lowest weighted average score.
* The confidence intervals for all agents overlap to some extent, suggesting that the differences in performance may not always be statistically significant.
* The performance of the agents generally increases with model complexity (GPT-4o mini < GPT-4 Turbo < GPT-4o < ol-preview < ol < Claude 3.5 Sonnet).
### Interpretation
The data suggests that more advanced language models (like Claude 3.5 Sonnet) perform better on this test suite than less advanced models (like GPT-4o mini). The inclusion of human performance benchmarks provides a useful context for evaluating the agents' capabilities. The 95% confidence intervals indicate the range within which the true performance of each agent is likely to fall. The success threshold of 0.9 suggests that none of the agents consistently achieve the level of performance considered "successful" based on this metric. The horizon weighting and bootstrapping suggest that the scores are robust to variations in the test data and evaluation methodology. The fact that the error bars overlap indicates that the differences between some of the agents may not be statistically significant, and further testing may be needed to determine whether these differences are real. The chart demonstrates a clear trend of increasing performance with model advancement, but also highlights the gap between current AI performance and human-level performance, even with limited time constraints.