## Bar Chart: Agent Performance on Test Suite (95% CI)
### Overview
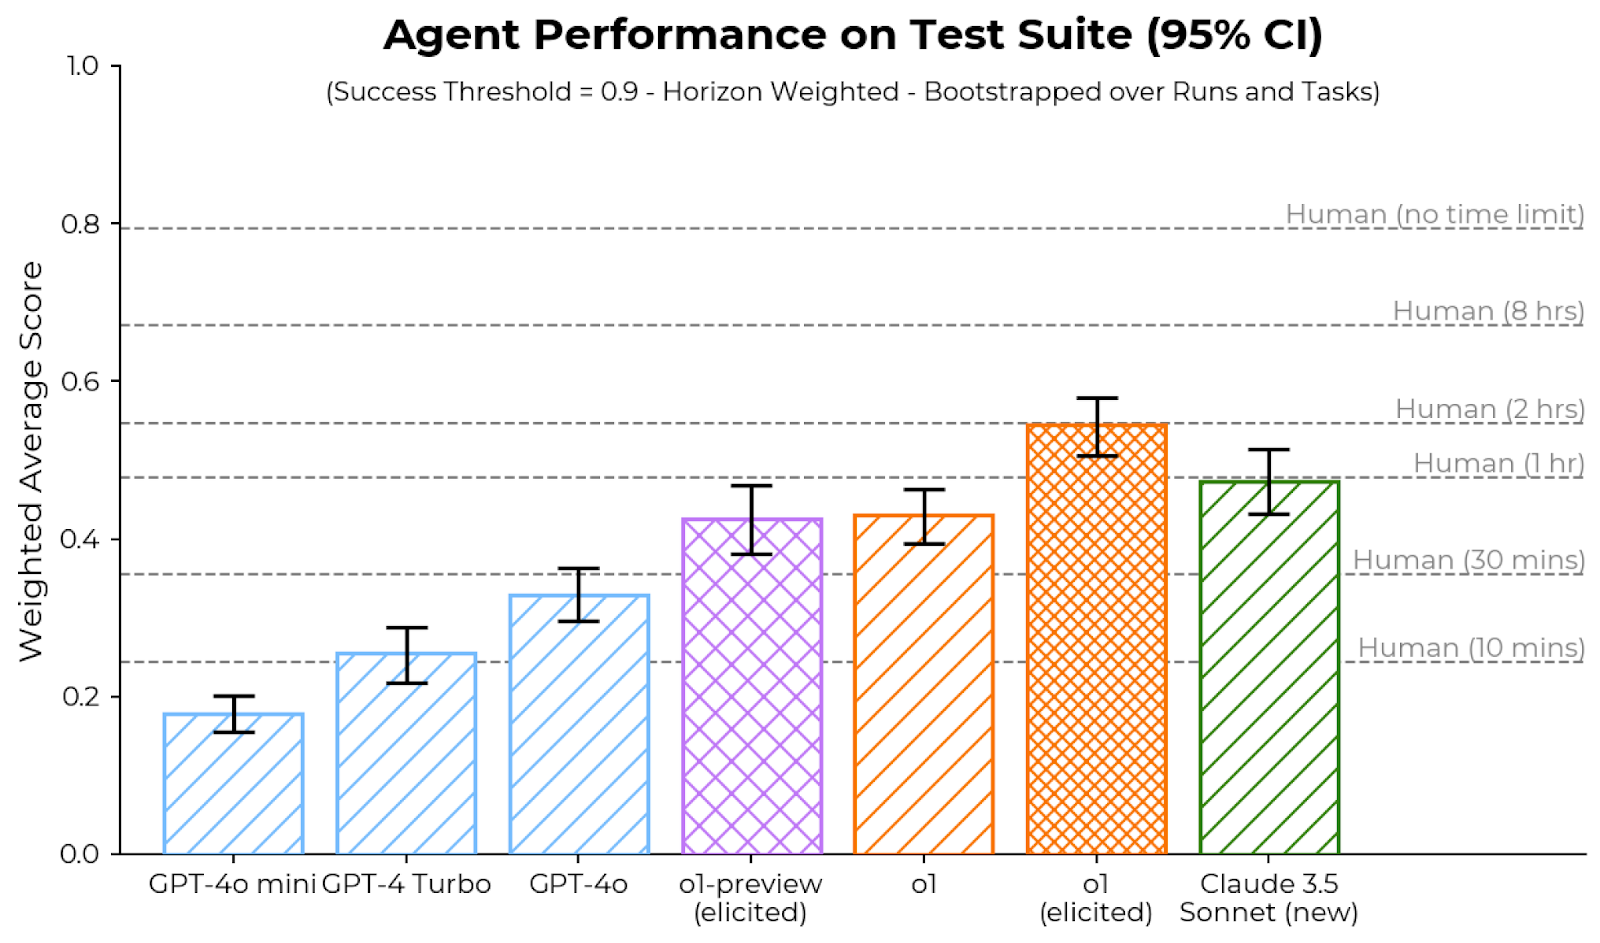
This is a bar chart comparing the performance of seven different AI agent models on a test suite. Performance is measured as a "Weighted Average Score" on a scale from 0.0 to 1.0. The chart includes 95% confidence intervals (CI) for each model's score and horizontal reference lines indicating human performance levels under different time constraints. The subtitle specifies the scoring methodology: "Success Threshold = 0.9 - Horizon Weighted - Bootstrapped over Runs and Tasks".
### Components/Axes
* **Chart Title:** "Agent Performance on Test Suite (95% CI)"
* **Subtitle:** "(Success Threshold = 0.9 - Horizon Weighted - Bootstrapped over Runs and Tasks)"
* **Y-Axis:**
* **Label:** "Weighted Average Score"
* **Scale:** Linear, from 0.0 to 1.0, with major tick marks at 0.0, 0.2, 0.4, 0.6, 0.8, and 1.0.
* **X-Axis:**
* **Labels (Models):** Seven distinct AI models are listed from left to right:
1. GPT-4o mini
2. GPT-4 Turbo
3. GPT-4o
4. o1-preview (elicited)
5. o1
6. o1 (elicited)
7. Claude 3.5 Sonnet (new)
* **Human Performance Benchmarks (Horizontal Dashed Lines):**
* Located on the right side of the chart, these lines are labeled with human performance under specific time limits.
* **Human (no time limit):** ~0.80
* **Human (8 hrs):** ~0.67
* **Human (2 hrs):** ~0.55
* **Human (1 hr):** ~0.48
* **Human (30 mins):** ~0.36
* **Human (10 mins):** ~0.24
### Detailed Analysis
**Model Performance (Approximate Values with 95% CI):**
The bars are ordered from lowest to highest performance. Each bar has a distinct color and hatch pattern.
1. **GPT-4o mini (Light blue, diagonal hatch):**
* **Trend:** Lowest performing model.
* **Score:** ~0.18
* **95% CI Range:** ~0.16 to 0.20
2. **GPT-4 Turbo (Light blue, diagonal hatch):**
* **Trend:** Second lowest, shows improvement over GPT-4o mini.
* **Score:** ~0.25
* **95% CI Range:** ~0.22 to 0.28
3. **GPT-4o (Light blue, diagonal hatch):**
* **Trend:** Third lowest, continues the upward trend.
* **Score:** ~0.33
* **95% CI Range:** ~0.30 to 0.36
4. **o1-preview (elicited) (Purple, cross-hatch):**
* **Trend:** Significant jump in performance compared to the GPT-4 series.
* **Score:** ~0.42
* **95% CI Range:** ~0.38 to 0.46
5. **o1 (Orange, diagonal hatch):**
* **Trend:** Slightly higher than o1-preview (elicited).
* **Score:** ~0.43
* **95% CI Range:** ~0.39 to 0.47
6. **o1 (elicited) (Orange, cross-hatch):**
* **Trend:** Highest performing model in the chart.
* **Score:** ~0.55
* **95% CI Range:** ~0.51 to 0.59
7. **Claude 3.5 Sonnet (new) (Green, diagonal hatch):**
* **Trend:** Second highest performance, slightly below o1 (elicited).
* **Score:** ~0.47
* **95% CI Range:** ~0.43 to 0.51
**Human Benchmark Comparison:**
* The top-performing model, **o1 (elicited)**, with a score of ~0.55, aligns closely with the **Human (2 hrs)** benchmark (~0.55).
* **Claude 3.5 Sonnet (new)** (~0.47) and **o1** (~0.43) perform near the **Human (1 hr)** benchmark (~0.48).
* The **o1-preview (elicited)** model (~0.42) sits between the **Human (1 hr)** and **Human (30 mins)** (~0.36) benchmarks.
* The GPT-4 series models all score below the **Human (30 mins)** benchmark.
### Key Observations
1. **Clear Performance Hierarchy:** There is a distinct, stepwise increase in performance from left to right, culminating with the "o1" family of models and Claude 3.5 Sonnet.
2. **"Elicited" Variant Advantage:** For the "o1" model, the "elicited" variant (cross-hatch, orange) shows a substantial performance increase (~0.55) over the standard "o1" (diagonal hatch, orange, ~0.43).
3. **Model Family Grouping:** The three GPT-4 series models (light blue) cluster at the lower end. The two "o1" models (orange) and the "o1-preview" (purple) form a middle-to-high tier. Claude 3.5 Sonnet (green) is a high-performing outlier from a different model family.
4. **Confidence Intervals:** The 95% confidence intervals (error bars) are relatively narrow for all models, suggesting consistent performance across runs and tasks. The intervals for the top three models (o1 (elicited), Claude 3.5 Sonnet, o1) overlap slightly, indicating their performance difference may not be statistically definitive at the 95% level.
5. **Human-AI Gap:** Even the best-performing AI agent (o1 (elicited)) only matches human performance given a 2-hour time constraint. The "Human (no time limit)" benchmark (~0.80) remains significantly higher than any AI score.
### Interpretation
This chart demonstrates the rapid advancement of AI agent capabilities on complex, horizon-weighted tasks. The data suggests that:
* **Model architecture and training methodology matter significantly.** The "o1" series, likely employing different reasoning or planning techniques, substantially outperforms the GPT-4 series on this specific test suite.
* **Prompting or elicitation techniques ("elicited") can unlock higher performance** from the same base model, as seen in the large gap between "o1" and "o1 (elicited)".
* **AI agents are approaching, but have not yet surpassed, human-level performance under moderate time constraints** (1-2 hours) for this class of problems. The persistent gap to the "no time limit" human benchmark indicates that tasks requiring deep, sustained reasoning or creativity remain a challenge.
* The test suite's design, using a high success threshold (0.9) and horizon weighting, likely emphasizes reliability and long-horizon planning, areas where the newer models show marked improvement.
The chart serves as a benchmark for the state of AI agents as of its publication date, highlighting both the progress made and the remaining distance to human expert performance on open-ended, time-unconstrained tasks.