## Line Chart: NDCG@10 vs Epochs for MRL and SMRL
### Overview
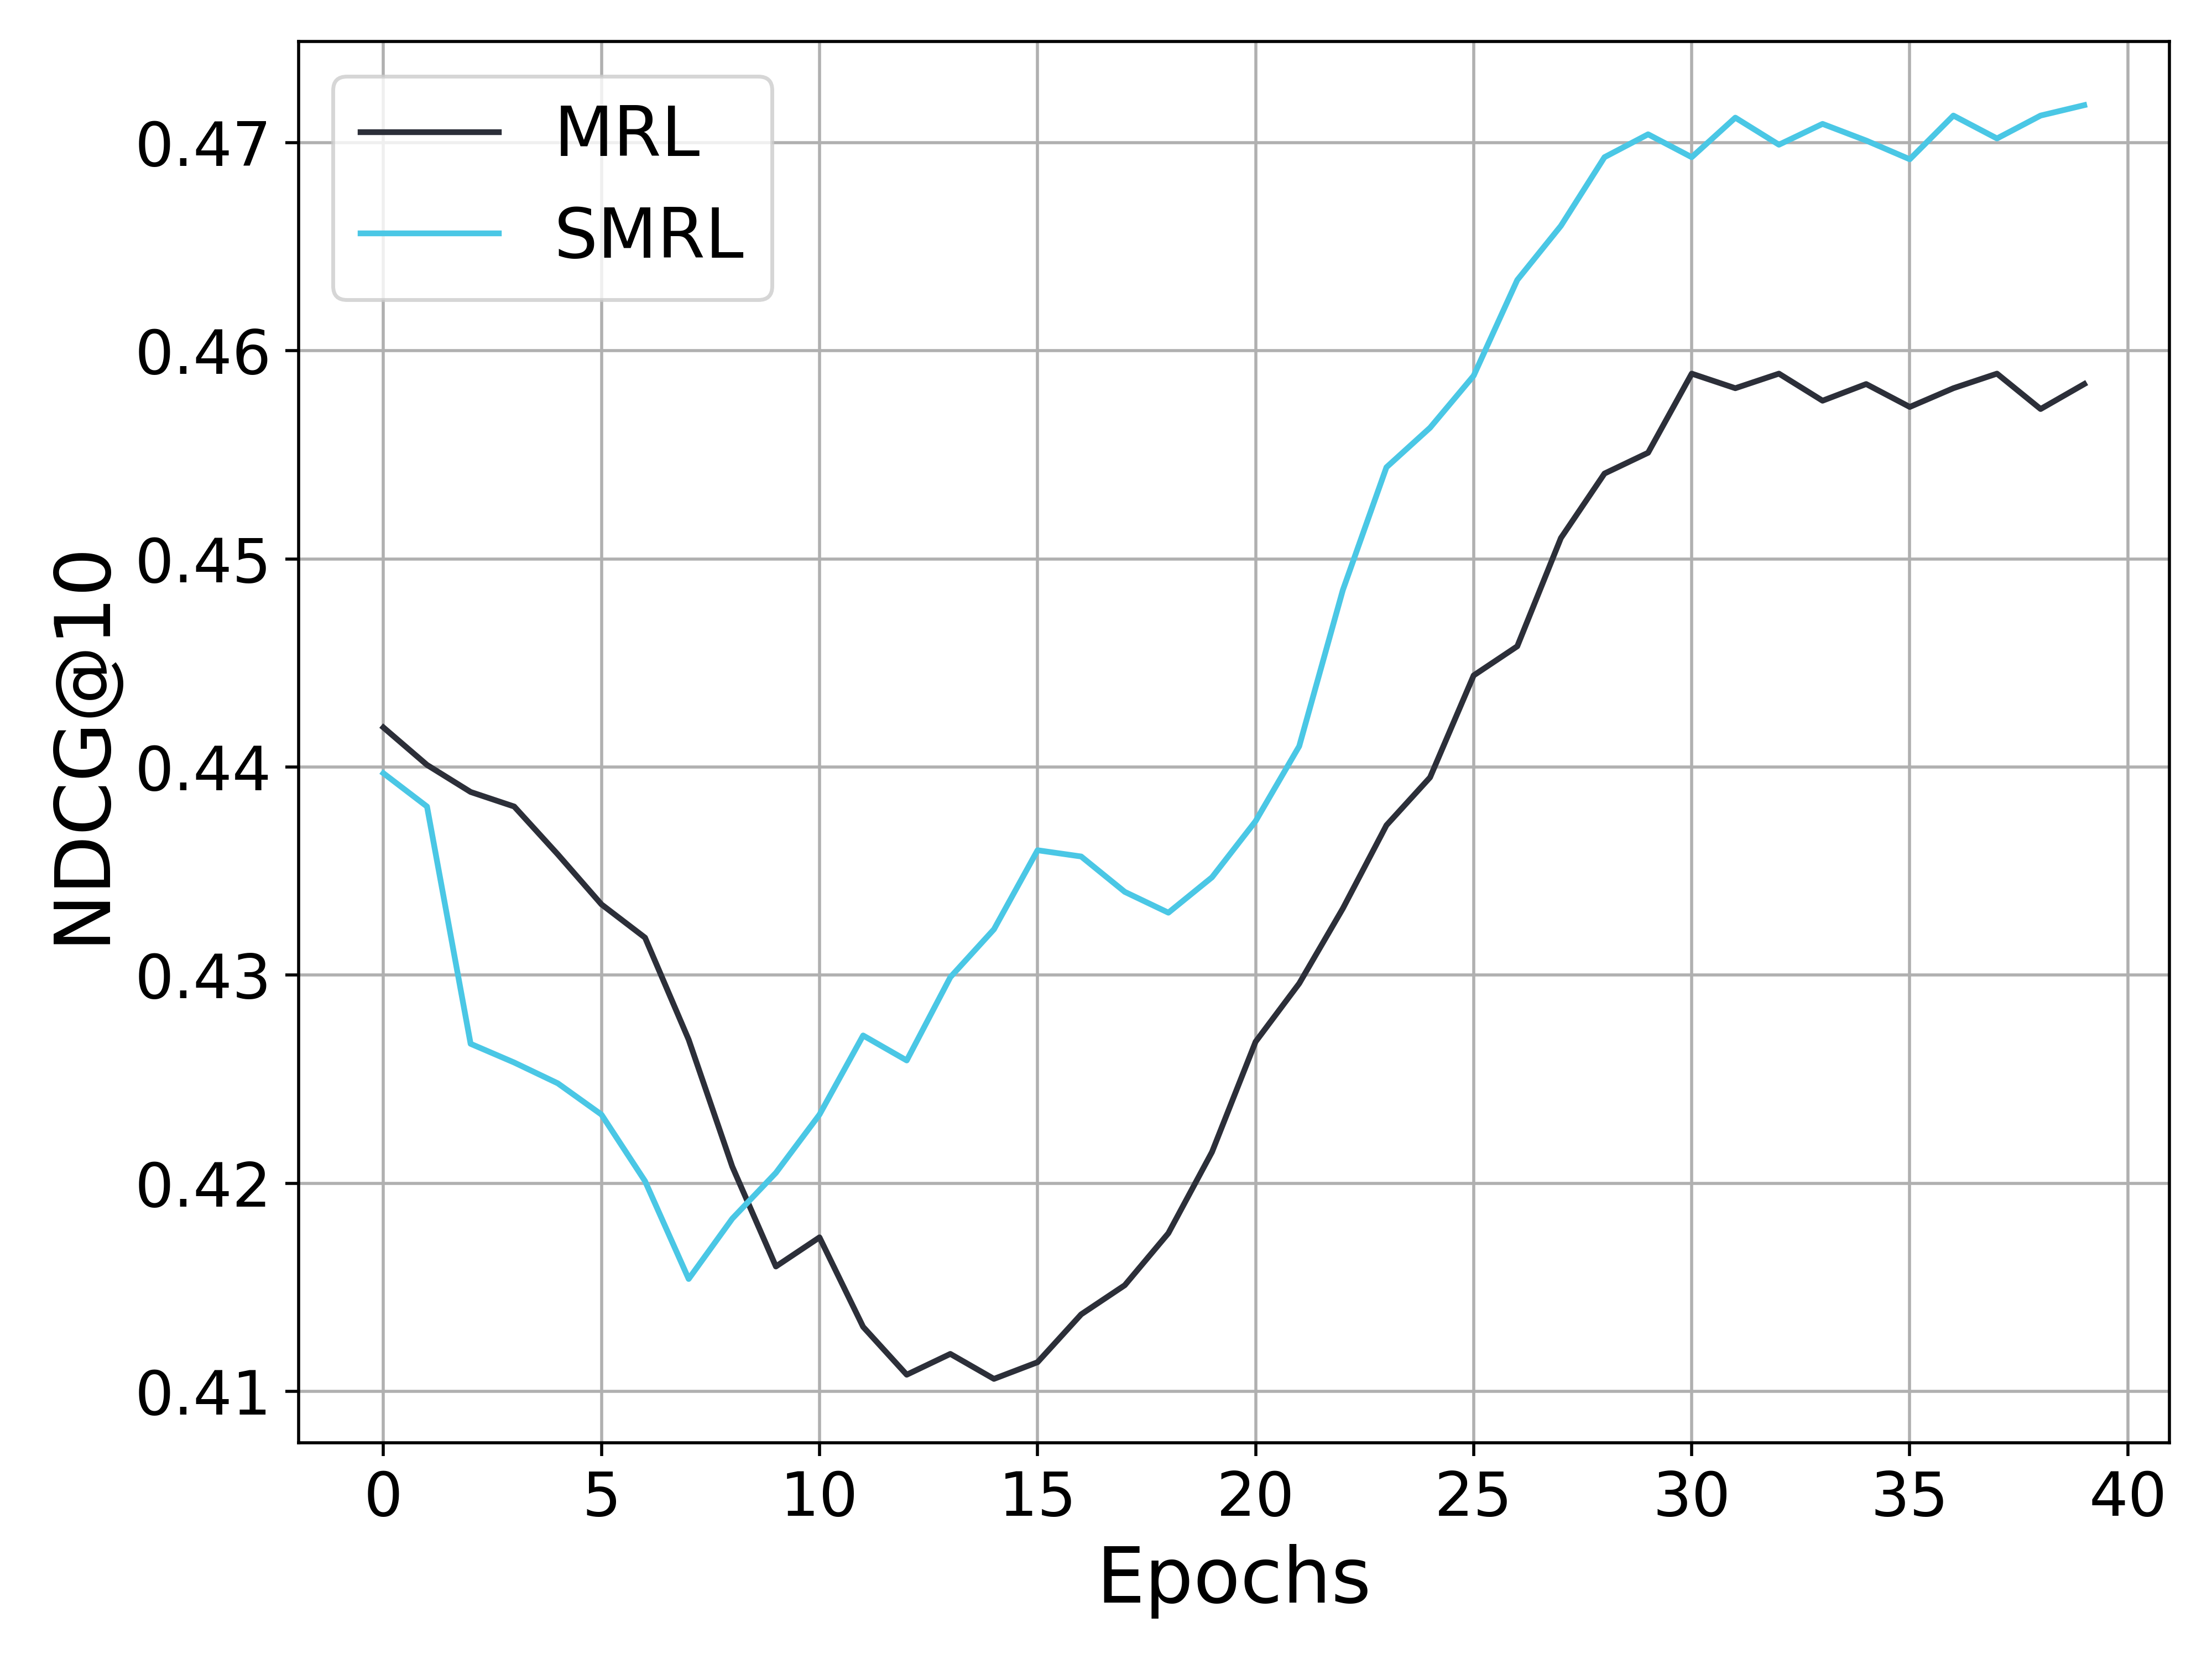
The image is a line chart comparing the performance of two models, MRL and SMRL, over 40 epochs. The y-axis represents NDCG@10, a metric for ranking quality, and the x-axis represents the number of epochs. The chart shows how the NDCG@10 score changes for each model as training progresses.
### Components/Axes
* **X-axis:** Epochs, ranging from 0 to 40 in increments of 5.
* **Y-axis:** NDCG@10, ranging from 0.41 to 0.47 in increments of 0.01.
* **Legend (top-left):**
* MRL (black line)
* SMRL (cyan line)
### Detailed Analysis
* **MRL (black line):**
* Trend: Initially decreases, then increases significantly, and finally plateaus.
* Data Points:
* Epoch 0: Approximately 0.442
* Epoch 10: Approximately 0.412
* Epoch 20: Approximately 0.426
* Epoch 30: Approximately 0.459
* Epoch 40: Approximately 0.458
* **SMRL (cyan line):**
* Trend: Decreases sharply, then increases significantly, and plateaus at a higher level than MRL.
* Data Points:
* Epoch 0: Approximately 0.440
* Epoch 10: Approximately 0.416
* Epoch 20: Approximately 0.434
* Epoch 30: Approximately 0.470
* Epoch 40: Approximately 0.472
### Key Observations
* Both models initially experience a decrease in NDCG@10.
* SMRL consistently outperforms MRL after approximately epoch 23.
* Both models plateau in performance after approximately epoch 30.
* SMRL reaches a higher peak NDCG@10 value than MRL.
### Interpretation
The chart suggests that both MRL and SMRL models require a certain number of training epochs before they start to improve their ranking performance. The initial decrease in NDCG@10 could be due to the models exploring the search space before converging on a better solution. SMRL appears to be a more effective model, as it achieves a higher NDCG@10 score and plateaus at a higher level than MRL. The plateauing of both models suggests that further training beyond 30 epochs may not significantly improve their performance. The difference in performance between MRL and SMRL could be due to differences in their architecture, training data, or hyperparameters.