## Line Chart: NDCG@10 vs. Epochs for MRL and SMRL
### Overview
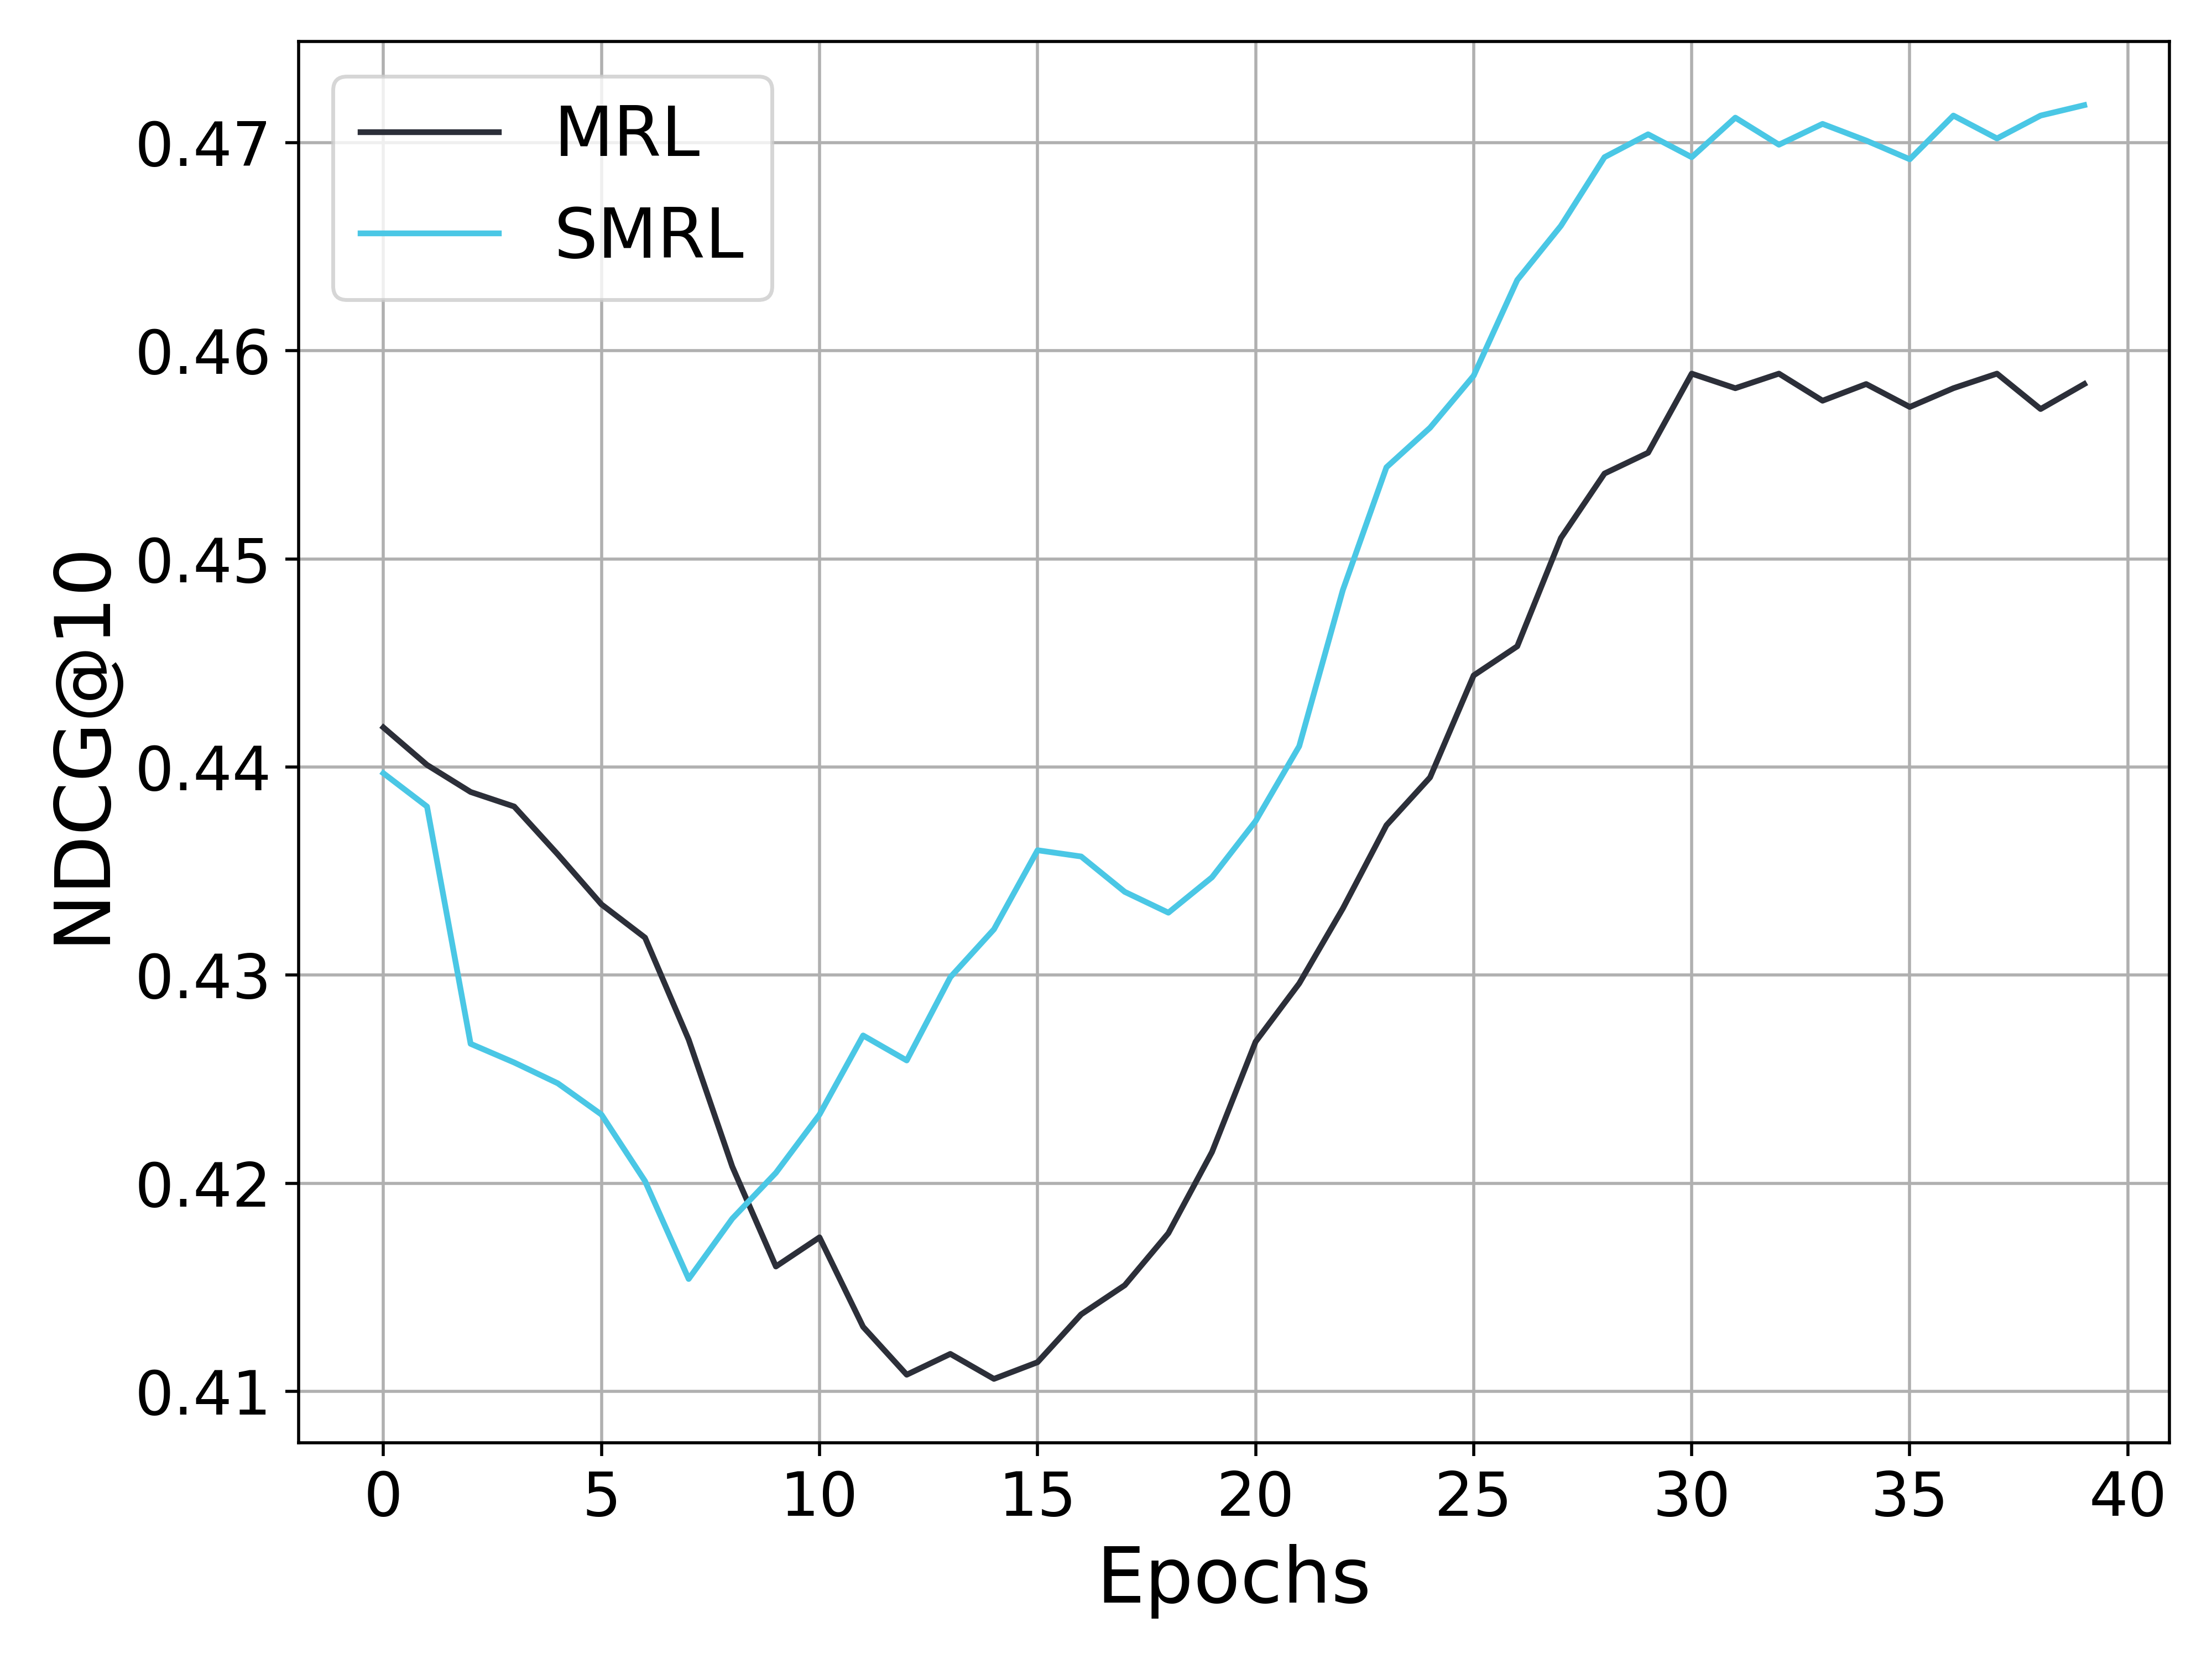
This image presents a line chart comparing the performance of two models, MRL and SMRL, over 40 epochs. The performance metric is NDCG@10, plotted on the y-axis, against the number of epochs on the x-axis. The chart shows how the NDCG@10 score changes as the models are trained for more epochs.
### Components/Axes
* **X-axis:** "Epochs", ranging from 0 to 40.
* **Y-axis:** "NDCG@10", ranging from 0.41 to 0.47.
* **Legend:** Located in the top-left corner, identifying two lines:
* "MRL" - represented by a black line.
* "SMRL" - represented by a teal (cyan-blue) line.
* **Grid:** A light gray grid is overlaid on the chart for easier readability.
### Detailed Analysis
**MRL (Black Line):**
The MRL line starts at approximately 0.428 at epoch 0. It generally decreases until around epoch 10, reaching a minimum of approximately 0.412. From epoch 10 to epoch 25, the line exhibits an upward trend, increasing to around 0.458. Between epochs 25 and 40, the line fluctuates, oscillating between approximately 0.458 and 0.465, ending at approximately 0.463 at epoch 40.
**SMRL (Teal Line):**
The SMRL line begins at approximately 0.465 at epoch 0. It initially decreases rapidly to a minimum of approximately 0.425 at epoch 5. From epoch 5 to epoch 20, the line shows an increasing trend, reaching approximately 0.445 at epoch 20. Between epochs 20 and 30, the line increases sharply to a peak of approximately 0.472 at epoch 30. From epoch 30 to 40, the line fluctuates around 0.47, ending at approximately 0.471 at epoch 40.
**Data Points (Approximate):**
| Epoch | MRL | SMRL |
|-------|---------|---------|
| 0 | 0.428 | 0.465 |
| 5 | 0.424 | 0.425 |
| 10 | 0.412 | 0.430 |
| 15 | 0.422 | 0.440 |
| 20 | 0.440 | 0.445 |
| 25 | 0.458 | 0.460 |
| 30 | 0.460 | 0.472 |
| 35 | 0.463 | 0.470 |
| 40 | 0.463 | 0.471 |
### Key Observations
* SMRL consistently outperforms MRL across all epochs, maintaining a higher NDCG@10 score.
* Both models exhibit initial decreases in performance before improving with training.
* SMRL shows a more rapid increase in performance between epochs 20 and 30 compared to MRL.
* Both models appear to converge in performance after epoch 30, with fluctuations around their peak values.
### Interpretation
The chart demonstrates the training progress of two ranking models, MRL and SMRL, using the NDCG@10 metric. The initial decrease in performance for both models could be attributed to the model adjusting to the training data and potentially overfitting to initial batches. The subsequent increase indicates learning and improvement in ranking quality. The superior performance of SMRL suggests that its architecture or training process is more effective at learning the underlying ranking function. The convergence of the lines after epoch 30 suggests that both models are approaching their maximum performance potential, and further training may yield diminishing returns. The fluctuations in the later epochs could be due to the stochastic nature of the training process or the inherent variability in the evaluation data. The data suggests that SMRL is a more effective model for this ranking task, but both models benefit from continued training up to a certain point.