## Line Chart: NDCG@10 Performance Over Training Epochs
### Overview
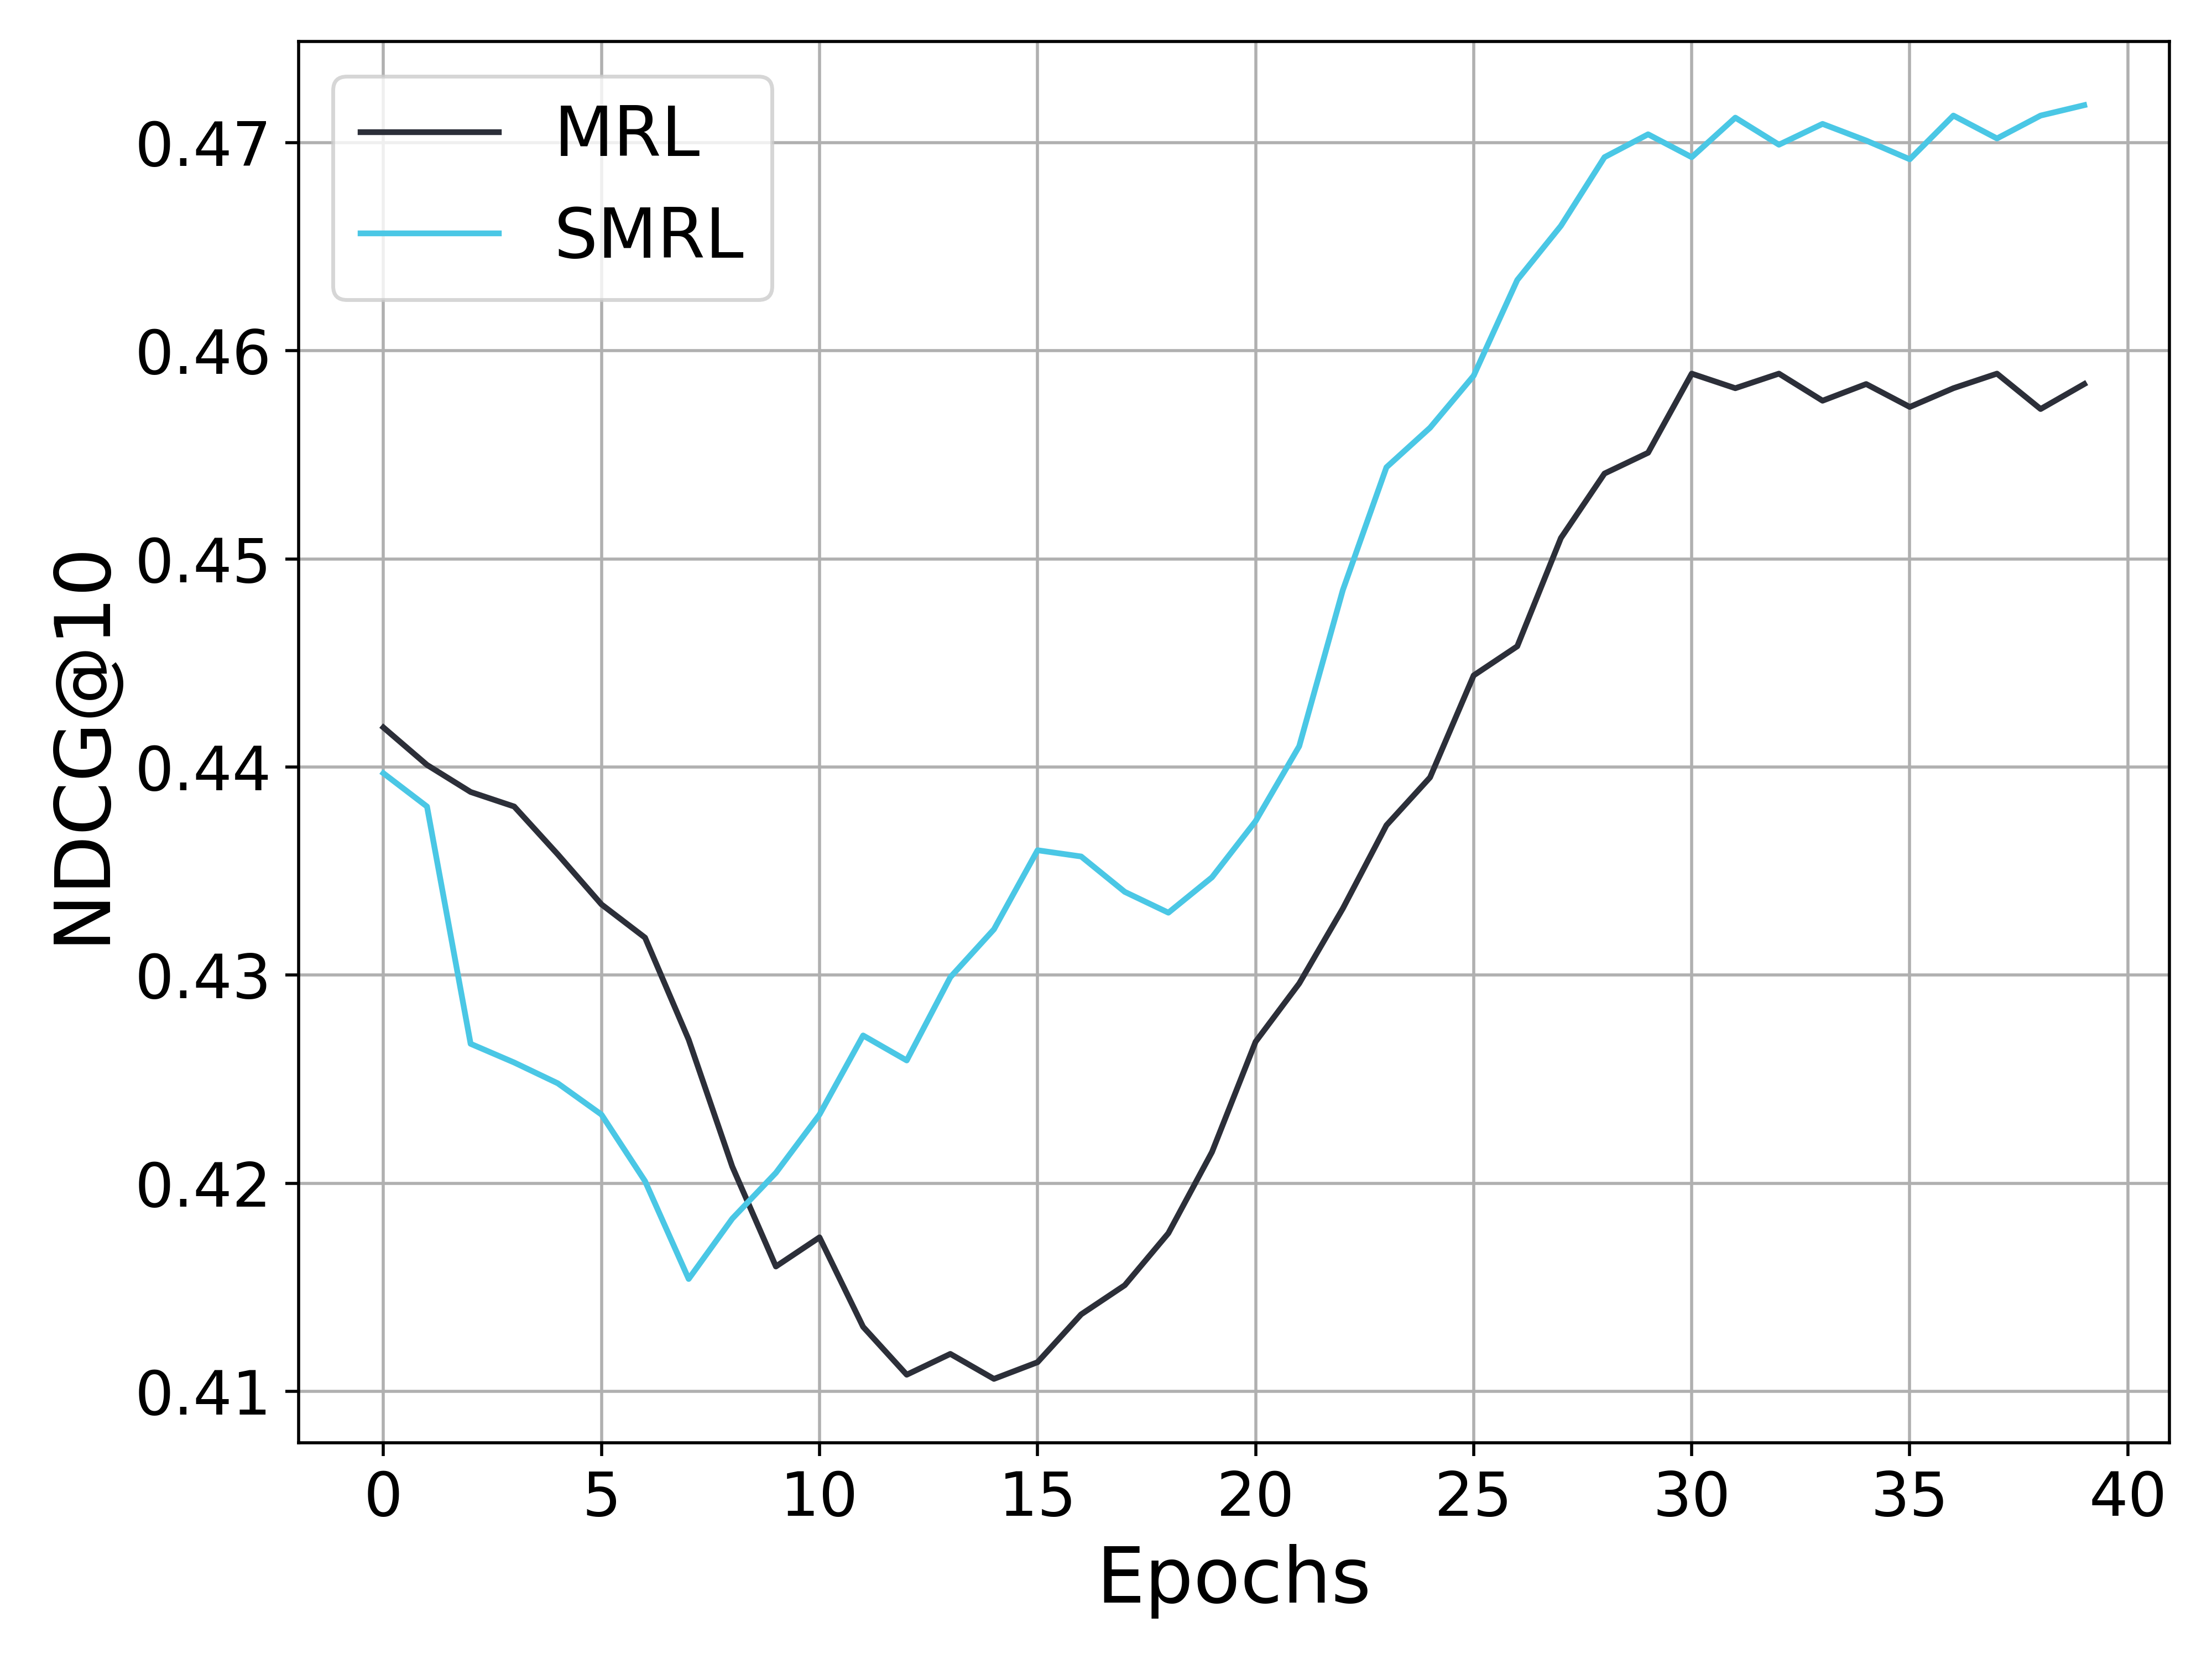
The image displays a line chart comparing the performance of two models, labeled MRL and SMRL, over the course of 40 training epochs. The performance metric is NDCG@10 (Normalized Discounted Cumulative Gain at rank 10), a common measure for ranking quality in information retrieval and recommendation systems. The chart shows that both models experience an initial performance decline followed by a recovery and improvement, with SMRL ultimately achieving a higher final score.
### Components/Axes
* **Chart Type:** Line chart with two data series.
* **X-Axis:**
* **Label:** "Epochs"
* **Scale:** Linear, from 0 to 40.
* **Major Tick Marks:** 0, 5, 10, 15, 20, 25, 30, 35, 40.
* **Y-Axis:**
* **Label:** "NDCG@10"
* **Scale:** Linear, from approximately 0.41 to 0.47.
* **Major Tick Marks:** 0.41, 0.42, 0.43, 0.44, 0.45, 0.46, 0.47.
* **Legend:**
* **Position:** Top-left corner of the plot area.
* **Items:**
1. **MRL:** Represented by a solid black line.
2. **SMRL:** Represented by a solid cyan (light blue) line.
* **Grid:** A light gray grid is present, aligning with the major tick marks on both axes.
### Detailed Analysis
**Trend Verification & Data Point Extraction (Approximate Values):**
* **MRL (Black Line):**
* **Trend:** Starts high, declines to a minimum around epoch 12-15, then recovers with a strong upward trend, plateauing after epoch 30.
* **Key Points:**
* Epoch 0: ~0.442
* Epoch 5: ~0.433
* Epoch 10: ~0.417 (Local low)
* Epoch 15: ~0.411 (Approximate global minimum)
* Epoch 20: ~0.427
* Epoch 25: ~0.445
* Epoch 30: ~0.459
* Epoch 35: ~0.458
* Epoch 40: ~0.459
* **SMRL (Cyan Line):**
* **Trend:** Starts slightly lower than MRL, declines to a minimum around epoch 7, then begins a recovery earlier and more steeply than MRL. It surpasses MRL around epoch 15 and maintains a lead, ending at the highest value on the chart.
* **Key Points:**
* Epoch 0: ~0.440
* Epoch 5: ~0.423
* Epoch 7: ~0.415 (Approximate global minimum)
* Epoch 10: ~0.423
* Epoch 15: ~0.436
* Epoch 20: ~0.438
* Epoch 25: ~0.459
* Epoch 30: ~0.470
* Epoch 35: ~0.470
* Epoch 40: ~0.472
### Key Observations
1. **Initial Performance Drop:** Both models show a significant decrease in NDCG@10 during the first ~10-15 epochs, suggesting a period of adjustment or instability early in training.
2. **Divergent Recovery:** The SMRL model begins its recovery sooner (around epoch 7) and at a faster rate than MRL (which bottoms around epoch 15).
3. **Crossover Point:** The performance lines intersect between epoch 10 and 15. After this point, SMRL consistently outperforms MRL.
4. **Final Performance Gap:** By epoch 40, SMRL achieves an NDCG@10 of ~0.472, while MRL reaches ~0.459, indicating a clear performance advantage for SMRL in the later stages of training.
5. **Volatility:** Both lines exhibit minor fluctuations, particularly during the recovery phase, but the overall trends are distinct and clear.
### Interpretation
This chart likely presents results from an experiment comparing two machine learning models (MRL and SMRL) on a ranking task. The NDCG@10 metric evaluates how well the models order relevant items at the top of a list.
The data suggests that the **SMRL model is more effective and robust in the long run**. While both models suffer from an initial "learning dip," SMRL demonstrates a superior ability to recover and improve. Its steeper learning curve after epoch 7 and higher final plateau indicate it may have a better optimization strategy, architecture, or regularization technique that prevents it from getting stuck in the poor local minimum that affects MRL until later in training.
The initial decline could be due to factors like aggressive learning rates, the model moving away from a pre-trained state, or the inherent difficulty of the task before the model finds a good gradient direction. The fact that SMRL overcomes this faster is a key finding. For a practitioner, this chart would argue for the adoption of the SMRL method over MRL for this specific task, as it yields a ~1.3 percentage point higher NDCG@10 score after 40 epochs, which can be a significant margin in ranking applications.