## Line Graph: NDCG@10 Performance Comparison Across Epochs
### Overview
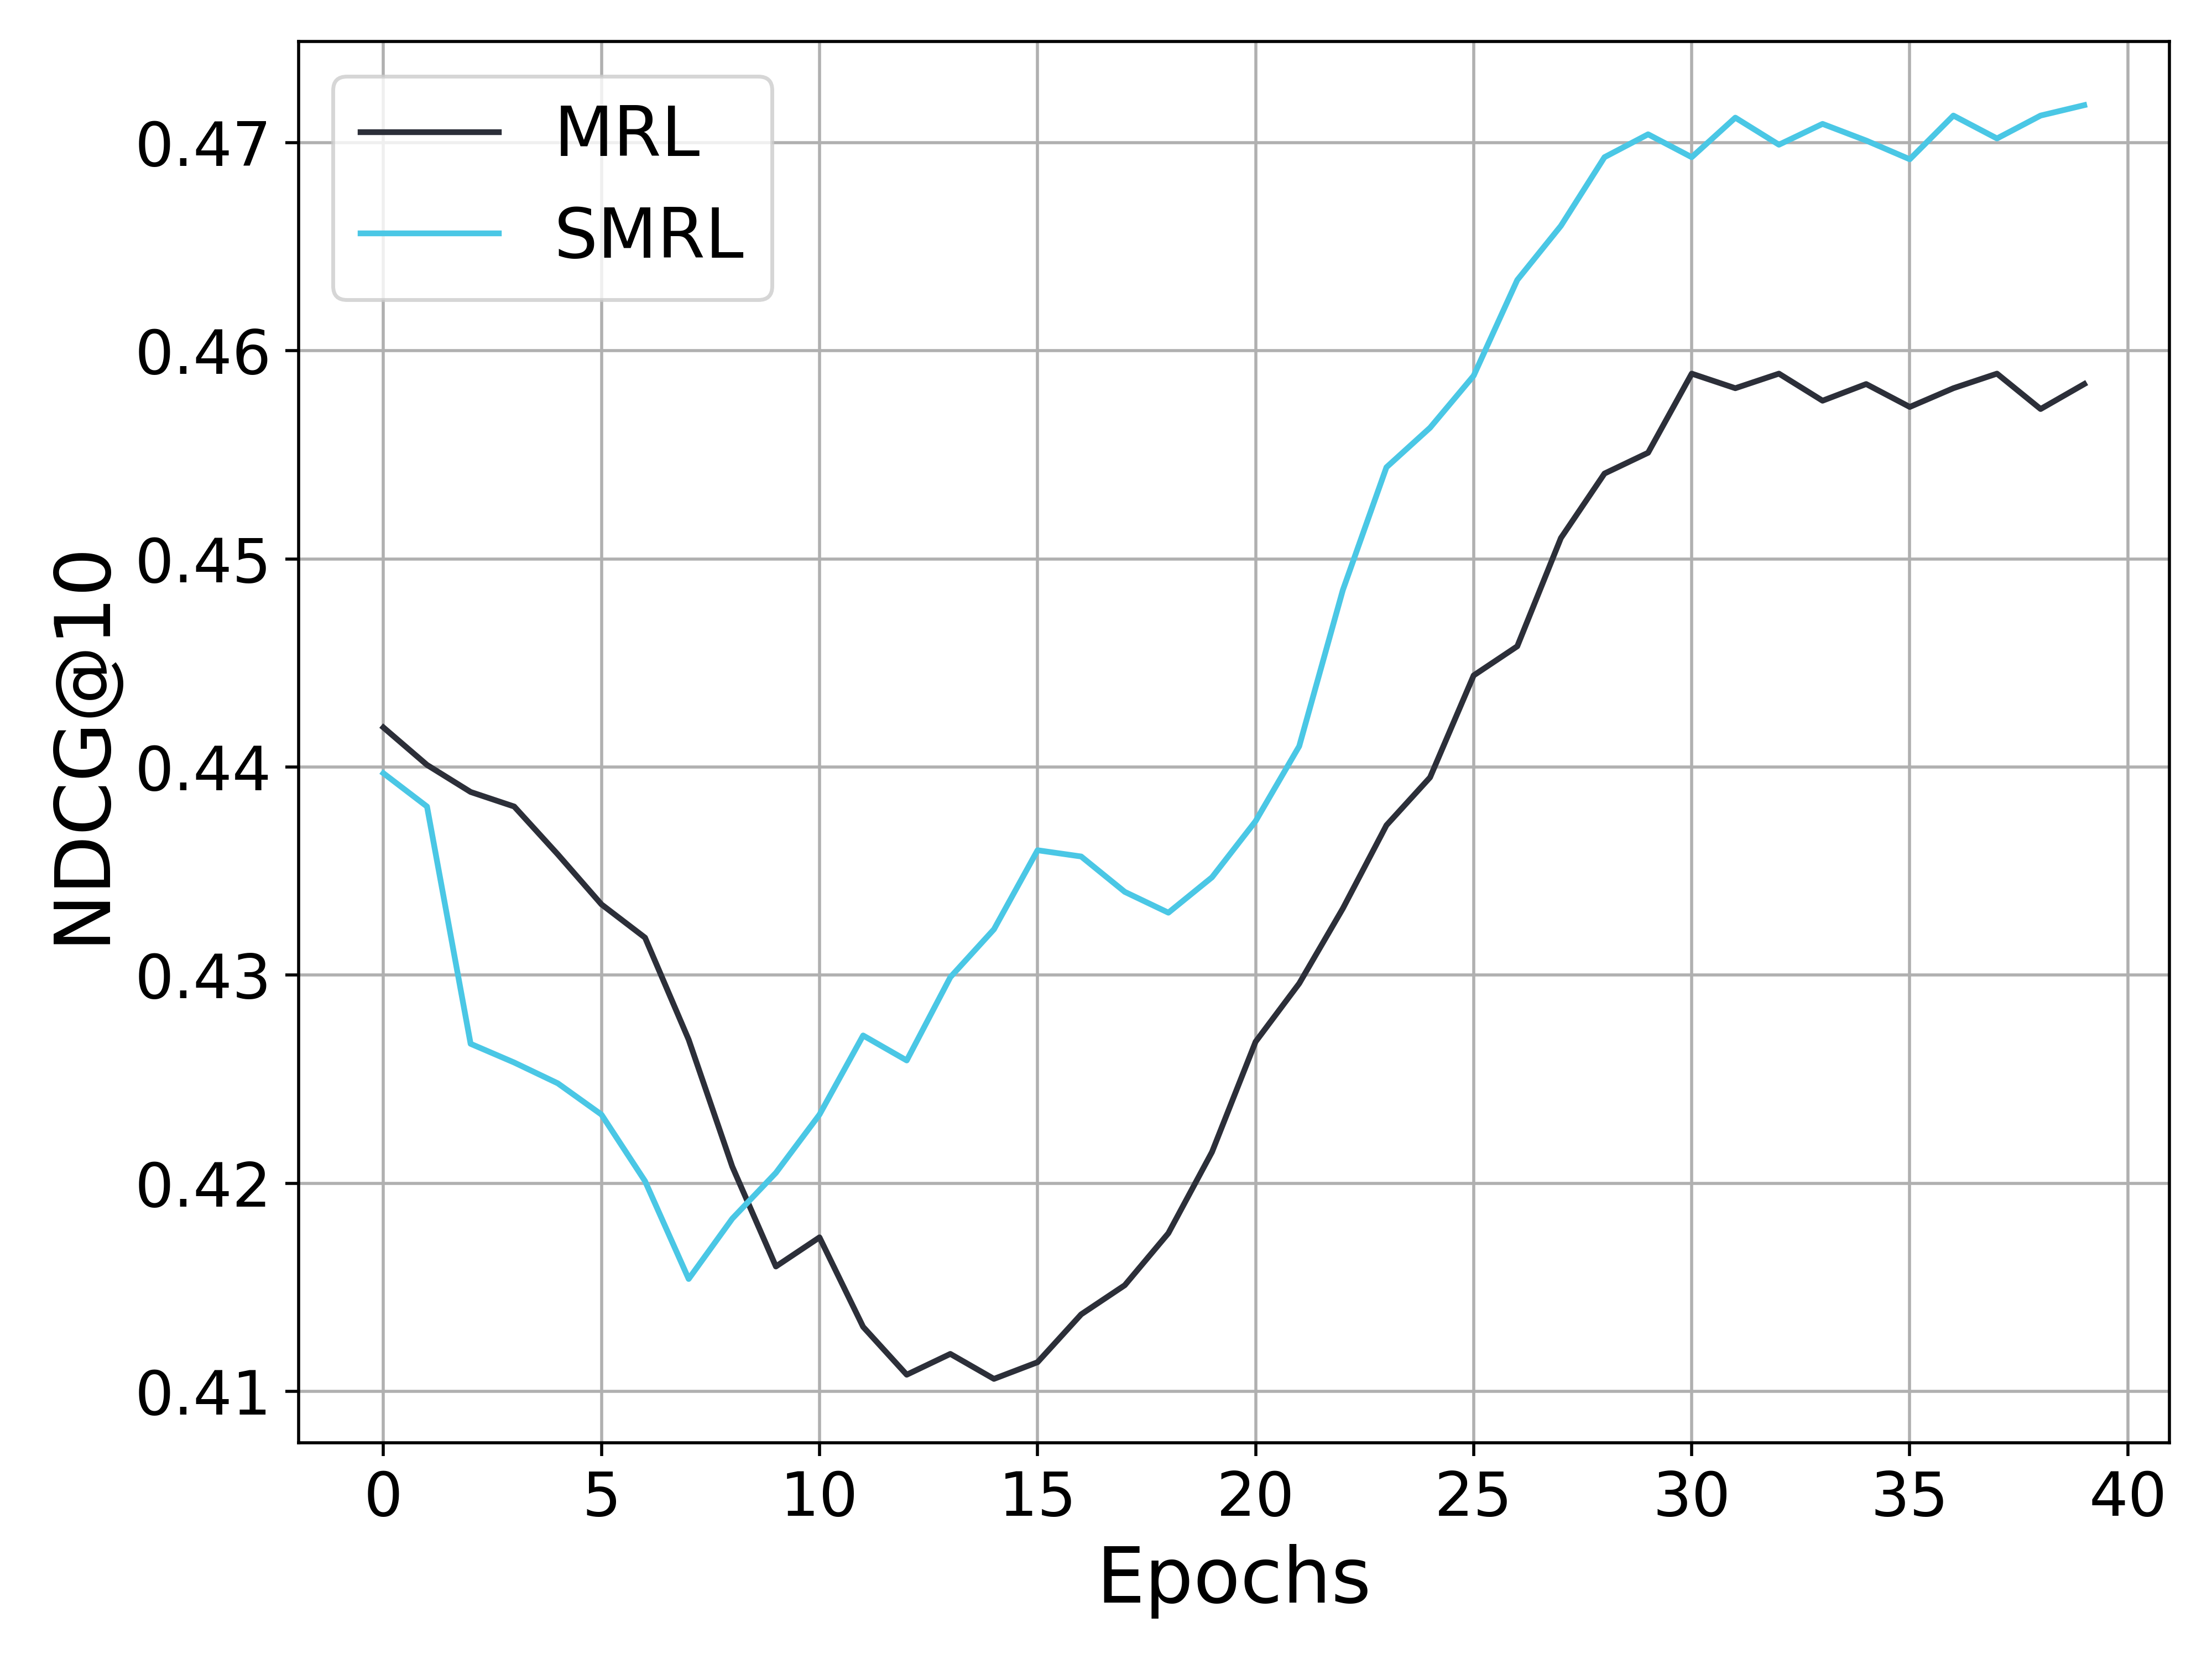
The image depicts a line graph comparing the performance of two algorithms, MRL (black line) and SMRL (blue line), measured by NDCG@10 metric across 40 training epochs. Both lines exhibit fluctuating trends with distinct divergence patterns over time.
### Components/Axes
- **X-axis (Epochs)**: Labeled "Epochs" with integer markers from 0 to 40 in increments of 5.
- **Y-axis (NDCG@10)**: Labeled "NDCG@10" with decimal markers from 0.41 to 0.47 in increments of 0.01.
- **Legend**: Positioned in the top-left corner, explicitly labeling:
- Black line: MRL
- Blue line: SMRL
- **Gridlines**: Subtle gray gridlines for reference.
### Detailed Analysis
1. **Initial Phase (Epochs 0–10)**:
- Both lines start near **0.44** at epoch 0.
- MRL (black) dips below SMRL (blue) by epoch 5, reaching ~0.43.
- SMRL recovers slightly but remains below MRL until epoch 10, where both lines cross (~0.42).
2. **Mid-Phase (Epochs 10–25)**:
- SMRL (blue) rises sharply, peaking at ~0.46 by epoch 25.
- MRL (black) remains flat (~0.42–0.43) until epoch 20, then begins a gradual ascent.
3. **Final Phase (Epochs 25–40)**:
- MRL overtakes SMRL around epoch 25, reaching ~0.46 by epoch 30.
- SMRL stabilizes near ~0.47, while MRL fluctuates between ~0.455–0.46.
### Key Observations
- **Crossing Points**:
- First crossover at epoch 10 (~0.42).
- Second crossover at epoch 25 (~0.46 for MRL vs. ~0.455 for SMRL).
- **Performance Divergence**:
- SMRL dominates early (epochs 0–25), while MRL outperforms later (epochs 25–40).
- **Stability**:
- SMRL shows sharper fluctuations (e.g., sharp rise at epoch 20), while MRL exhibits smoother growth post-epoch 20.
### Interpretation
The data suggests that SMRL achieves higher initial performance but experiences diminishing returns after epoch 25. In contrast, MRL demonstrates delayed but sustained improvement, surpassing SMRL by epoch 25 and maintaining a ~0.005 advantage by epoch 40. This could indicate that MRL’s optimization strategy (e.g., adaptive learning rates or regularization) becomes more effective with prolonged training, whereas SMRL may overfit or plateau earlier. The crossing points highlight critical epochs where algorithmic efficiency shifts, warranting further investigation into hyperparameter tuning or architectural differences.