## Radar Chart: Performance Comparison Across Datasets
### Overview
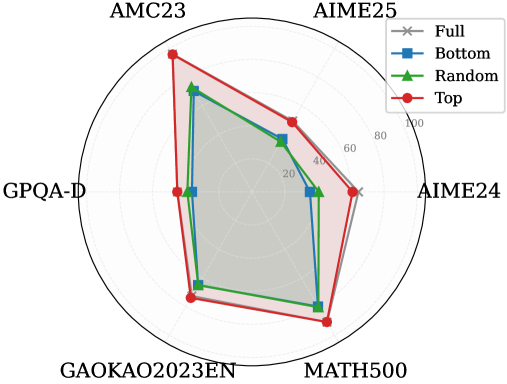
The image presents a radar chart comparing the performance of four different data sampling strategies – Full, Bottom, Random, and Top – across six datasets: AMC23, AIME25, AIME24, GPQA-D, GAOKAO2023EN, and MATH500. The chart uses a radial layout with values ranging from approximately 0 to 100, indicated by concentric circles.
### Components/Axes
* **Datasets (Axes):** AMC23, AIME25, AIME24, GPQA-D, GAOKAO2023EN, MATH500. These are evenly spaced around the circular chart.
* **Performance Scale (Radial Axis):** Concentric circles representing values from 0 to 100, in increments of 20.
* **Legend:** Located in the top-right corner, identifying the data series:
* Full (Grey, 'x' marker)
* Bottom (Blue, square marker)
* Random (Green, square marker)
* Top (Red, circle marker)
### Detailed Analysis
The chart displays the performance of each sampling strategy on each dataset as a polygon connecting the performance values.
* **Top (Red):** This line generally exhibits the highest performance, peaking at approximately 90 on the AIME25 axis. It dips to around 20 on the GAOKAO2023EN axis. The trend is highly variable, with significant peaks and troughs.
* AMC23: ~70
* AIME25: ~90
* AIME24: ~60
* GPQA-D: ~40
* GAOKAO2023EN: ~20
* MATH500: ~30
* **Random (Green):** This line shows moderate performance, generally lower than "Top" but higher than "Bottom". It has a relatively smooth profile.
* AMC23: ~40
* AIME25: ~60
* AIME24: ~50
* GPQA-D: ~40
* GAOKAO2023EN: ~40
* MATH500: ~40
* **Bottom (Blue):** This line consistently shows the lowest performance across all datasets, remaining generally below 40. It has a relatively flat profile.
* AMC23: ~20
* AIME25: ~30
* AIME24: ~30
* GPQA-D: ~30
* GAOKAO2023EN: ~30
* MATH500: ~30
* **Full (Grey):** This line shows intermediate performance, generally between "Random" and "Bottom". It has a somewhat irregular profile.
* AMC23: ~40
* AIME25: ~50
* AIME24: ~40
* GPQA-D: ~40
* GAOKAO2023EN: ~40
* MATH500: ~40
### Key Observations
* The "Top" sampling strategy consistently outperforms the others on most datasets, particularly AIME25 and AMC23.
* The "Bottom" sampling strategy consistently underperforms across all datasets.
* GAOKAO2023EN appears to be the most challenging dataset for all sampling strategies, resulting in the lowest performance scores.
* AIME25 appears to be the easiest dataset, with the highest performance scores.
* The performance differences between "Random" and "Full" are relatively small.
### Interpretation
The radar chart suggests that selecting the "Top" performing samples yields the best results across the evaluated datasets. This could indicate that the most challenging or informative samples are crucial for achieving high performance. Conversely, selecting the "Bottom" performing samples consistently leads to the worst results, suggesting these samples are less representative or contain less valuable information. The consistent low performance on GAOKAO2023EN suggests this dataset possesses unique characteristics that make it difficult for all sampling strategies to effectively capture its underlying patterns. The relatively similar performance of "Random" and "Full" suggests that, for these datasets, a random sample provides comparable results to using the entire dataset, potentially offering a computational efficiency benefit. The chart highlights the importance of sample selection in influencing model performance and suggests that a targeted approach (e.g., "Top" sampling) can significantly improve results.