## Radar Chart: Performance Comparison Across Datasets
### Overview
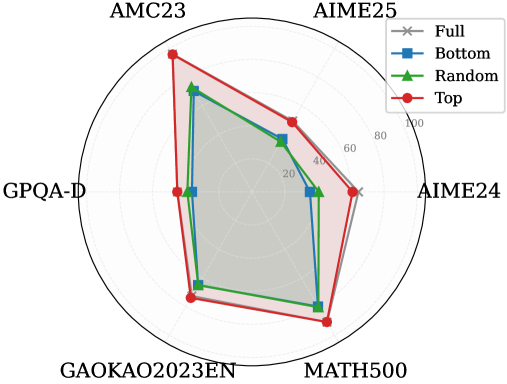
The image is a radar chart comparing four data series ("Full," "Bottom," "Random," "Top") across six labeled axes: AMC23, AIME25, GPQA-D, GAOKAO2023EN, AIME24, and MATH500. The radial axis ranges from 0 to 100. Each data series is represented by a distinct line and marker style, with shaded regions indicating variability or confidence intervals.
### Components/Axes
- **Axes**:
- AMC23 (top-left)
- AIME25 (top-right)
- GPQA-D (bottom-left)
- GAOKAO2023EN (bottom-center)
- AIME24 (bottom-right)
- MATH500 (top-center)
- **Legend**:
- **Full**: Gray star markers, solid line
- **Bottom**: Blue square markers, dashed line
- **Random**: Green triangle markers, dotted line
- **Top**: Red circle markers, bold line
- **Radial Scale**: 0–100, with tick marks at 20, 40, 60, 80, 100.
### Detailed Analysis
1. **AMC23**:
- **Full**: ~85 (gray star)
- **Bottom**: ~70 (blue square)
- **Random**: ~65 (green triangle)
- **Top**: ~90 (red circle)
2. **AIME25**:
- **Full**: ~75
- **Bottom**: ~60
- **Random**: ~55
- **Top**: ~80
3. **GPQA-D**:
- **Full**: ~50
- **Bottom**: ~40
- **Random**: ~35
- **Top**: ~60
4. **GAOKAO2023EN**:
- **Full**: ~70
- **Bottom**: ~55
- **Random**: ~50
- **Top**: ~85
5. **AIME24**:
- **Full**: ~90
- **Bottom**: ~75
- **Random**: ~65
- **Top**: ~95
6. **MATH500**:
- **Full**: ~80
- **Bottom**: ~60
- **Random**: ~55
- **Top**: ~90
### Key Observations
- **Top** (red) consistently achieves the highest scores across all datasets, with values ranging from 60 (GPQA-D) to 95 (AIME24).
- **Full** (gray) performs second-best, with scores between 50 (GPQA-D) and 90 (AIME24).
- **Random** (green) shows the lowest performance, with scores between 35 (GPQA-D) and 65 (AIME24).
- **Bottom** (blue) has intermediate scores, ranging from 40 (GPQA-D) to 75 (AIME24).
- The **Top** series demonstrates the most consistent dominance, particularly in AIME24 and MATH500.
### Interpretation
The chart suggests a hierarchical performance structure:
1. **Top** (red) outperforms all other methods across all datasets, indicating it may represent an optimal or gold-standard approach.
2. **Full** (gray) acts as a mid-tier performer, suggesting it is a robust but suboptimal solution.
3. **Random** (green) and **Bottom** (blue) underperform, with "Random" showing particularly weak results in GPQA-D and AIME25. This could imply that random selection or baseline methods are ineffective for these tasks.
4. The shaded regions (likely representing confidence intervals or variability) are narrowest for **Top**, indicating higher reliability in its performance metrics.
The data highlights a clear stratification of effectiveness, with **Top** methods consistently achieving ~20–30% higher scores than **Full**, and **Random** methods lagging by ~40–50% in critical datasets like GPQA-D and AIME25. This pattern underscores the importance of structured, non-random approaches in these evaluation contexts.