## Diagram: Graph Representations
### Overview
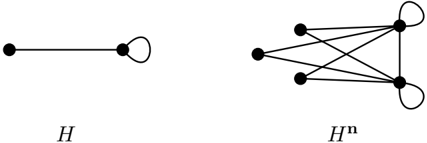
The image presents two graph diagrams, labeled *H* and *Hⁿ*. The first graph, *H*, consists of two nodes connected by a single edge, with a self-loop on one of the nodes. The second graph, *Hⁿ*, consists of four nodes with multiple edges connecting them, including a self-loop on one of the nodes.
### Components/Axes
* **Nodes:** Represented by black filled circles.
* **Edges:** Represented by black lines connecting nodes.
* **Self-loop:** A curved line originating and terminating at the same node.
* **Labels:**
* *H*: Label for the first graph, located below the diagram.
* *Hⁿ*: Label for the second graph, located below the diagram.
### Detailed Analysis
**Graph *H***:
* Two nodes are connected by a single edge.
* One of the nodes has a self-loop.
**Graph *Hⁿ***:
* Four nodes are present.
* Each node is connected to every other node, forming a complete graph.
* One of the nodes has a self-loop.
* There are a total of 6 edges connecting the 4 nodes.
### Key Observations
* Graph *H* is a simple graph with two nodes and one edge, plus a self-loop on one node.
* Graph *Hⁿ* is a more complex graph with four nodes and multiple edges, including a self-loop.
### Interpretation
The image illustrates two different graph structures. The graph *Hⁿ* appears to be a more complex version of *H*, possibly representing a transformation or evolution of the initial graph structure. The self-loops indicate a relationship of a node to itself. The complete connectivity of *Hⁿ* suggests a high degree of interaction or relationship between the nodes.