## Graph Diagram: Simple Graph (H) and Complex Graph (Hⁿ)
### Overview
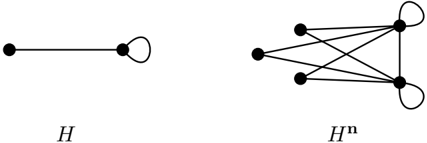
The image displays two distinct graph theory diagrams positioned side-by-side on a white background. The left diagram is labeled "H" and depicts a simple graph with two nodes. The right diagram is labeled "Hⁿ" and depicts a more complex, densely connected graph with five nodes. Both diagrams use black dots for nodes and solid black lines for edges.
### Components/Axes
* **Diagrams:** Two separate graph diagrams.
* **Labels:**
* Left Diagram: The label "H" is positioned directly below the graph.
* Right Diagram: The label "Hⁿ" is positioned directly below the graph. The "n" is a superscript.
* **Graph Elements:**
* **Nodes (Vertices):** Represented by solid black circles.
* **Edges (Lines):** Represented by solid black lines connecting nodes.
* **Self-Loops:** Edges that connect a node to itself, represented by a curved line originating and terminating at the same node.
### Detailed Analysis
**Diagram H (Left):**
* **Structure:** A graph with 2 nodes.
* **Node Placement:** One node on the left, one node on the right.
* **Connections:** A single straight edge connects the two nodes.
* **Additional Feature:** The right node has a self-loop attached to it.
* **Spatial Grounding:** The entire graph is centered horizontally. The self-loop is attached to the right side of the right node.
**Diagram Hⁿ (Right):**
* **Structure:** A graph with 5 nodes.
* **Node Placement:** The nodes are arranged in a rough pentagonal or circular layout. There is one node on the far left, two nodes in the upper-middle area, and two nodes in the lower-middle area.
* **Connections (Edge Analysis):**
* The far-left node is connected to all four other nodes (4 edges).
* The two upper-middle nodes are connected to each other, to the far-left node, and to both lower-middle nodes.
* The two lower-middle nodes are connected to each other, to the far-left node, and to both upper-middle nodes.
* This creates a dense web of connections. The graph appears to be a complete graph on 5 vertices (K₅), where every pair of distinct nodes is connected by a unique edge.
* **Additional Features:**
* The top-right node has a self-loop.
* The bottom-right node has a self-loop.
* **Spatial Grounding:** The graph is centered horizontally. The two self-loops are on the right side of the two rightmost nodes.
### Key Observations
1. **Progression in Complexity:** There is a clear visual and structural progression from the simple graph H to the complex graph Hⁿ. H has 2 nodes and 1 edge (+1 loop), while Hⁿ has 5 nodes and 10 edges (+2 loops).
2. **Connectivity:** H is minimally connected (a single path). Hⁿ is maximally connected (a complete graph), representing a significant increase in relational density.
3. **Self-Loops:** Both graphs contain self-loops, but their number and placement differ. In H, only one node has a loop. In Hⁿ, two nodes (the rightmost ones) have loops.
4. **Label Notation:** The label "Hⁿ" uses a superscript "n", which in mathematical notation often denotes an exponent, power, or iteration. This suggests Hⁿ is derived from or related to H through some operation (e.g., graph power, tensor product, or iterative expansion).
### Interpretation
This image is a technical illustration from the field of graph theory or network science. It visually contrasts a simple, foundational graph structure (H) with a more complex, derived structure (Hⁿ).
* **What the data suggests:** The diagrams demonstrate a transformation or operation that increases both the number of nodes (from 2 to 5) and the connectivity (from a single edge to a complete graph). The superscript "n" implies this could be one instance of a generalized process (e.g., the n-th power of a graph, or the result of n iterations of a graph rewriting rule).
* **Relationship between elements:** H serves as the base case or starting point. Hⁿ represents a more advanced, interconnected state. The presence of self-loops in both suggests that the property of "reflexivity" (a node relating to itself) is preserved or intentionally added during the transformation.
* **Notable patterns:** The most striking pattern is the shift from a linear, sparse structure to a dense, web-like structure. This could model concepts like network growth, the increase of relationships in a social group, or the expansion of states in a computational system. The specific transformation from a 2-node graph to a 5-node complete graph with loops would be defined by the mathematical context from which this image is taken.