# Technical Document Extraction: FreeLaw Data Plot
## 1. Component Isolation
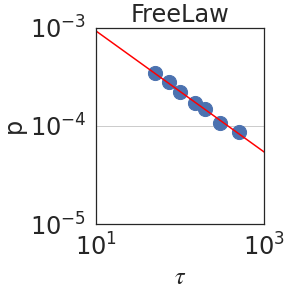
* **Header:** Contains the title "FreeLaw".
* **Main Chart Area:** A log-log scatter plot with a superimposed linear regression line.
* **Axes:**
* **Y-axis (Vertical):** Labeled "$p$".
* **X-axis (Horizontal):** Labeled "$\tau$".
## 2. Metadata and Labels
| Element | Value |
| :--- | :--- |
| **Title** | FreeLaw |
| **Y-axis Label** | $p$ |
| **X-axis Label** | $\tau$ |
| **Y-axis Scale** | Logarithmic ($10^{-5}$ to $10^{-3}$) |
| **X-axis Scale** | Logarithmic ($10^{1}$ to $10^{3}$) |
| **Language** | English |
## 3. Data Series Analysis
### Series 1: Observed Data Points
* **Visual Representation:** Large blue circular markers.
* **Trend Verification:** The data points follow a clear downward slope from left to right. As $\tau$ increases, $p$ decreases. The points are tightly clustered around a straight line on this log-log scale, indicating a power-law relationship.
* **Estimated Data Points (Logarithmic Scale):**
* Point 1: $\tau \approx 50, p \approx 3 \times 10^{-4}$
* Point 2: $\tau \approx 70, p \approx 2.5 \times 10^{-4}$
* Point 3: $\tau \approx 100, p \approx 2 \times 10^{-4}$
* Point 4: $\tau \approx 200, p \approx 1.5 \times 10^{-4}$
* Point 5: $\tau \approx 300, p \approx 1.3 \times 10^{-4}$
* Point 6: $\tau \approx 500, p \approx 1 \times 10^{-4}$
* Point 7: $\tau \approx 800, p \approx 8 \times 10^{-5}$
### Series 2: Trend Line
* **Visual Representation:** Solid red line.
* **Trend Verification:** Slopes downward. It acts as a "best fit" line for the blue data points.
* **Placement:** The line originates near the top-left corner ($10^1, 10^{-3}$) and terminates near the bottom-right corner ($10^3, 5 \times 10^{-5}$).
## 4. Axis Markers and Grid
* **Y-axis Ticks:** $10^{-3}$, $10^{-4}$, $10^{-5}$. There is a faint horizontal grid line at the $10^{-4}$ mark.
* **X-axis Ticks:** $10^{1}$, $10^{3}$. (Note: $10^2$ is implied in the center but not explicitly labeled).
## 5. Summary of Information
The image represents a scientific or statistical analysis titled **FreeLaw**. It illustrates the relationship between two variables, $\tau$ (tau) and $p$. Because the data forms a straight line on a log-log plot, it demonstrates that $p$ is proportional to $\tau$ raised to a negative power ($p \propto \tau^{-k}$). The blue markers represent empirical data, while the red line represents the theoretical or fitted model. The values for $p$ range between $10^{-3}$ and $10^{-5}$ as $\tau$ scales from $10^1$ to $10^3$.