# Technical Document Analysis: FreeLaw Scatter Plot
## Image Description
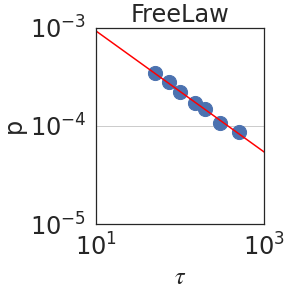
The image is a **log-log scatter plot** titled **"FreeLaw"**. It visualizes the relationship between two variables, **τ (tau)** on the x-axis and **ρ (rho)** on the y-axis. The plot includes a **red trend line** and **blue data points**, with axis labels and tick marks in scientific notation.
---
### Key Components
1. **Title**:
- **Text**: "FreeLaw"
- **Placement**: Top center of the plot.
2. **Axes**:
- **X-axis (τ)**:
- **Label**: "τ" (Greek letter tau).
- **Range**: \(10^1\) to \(10^3\).
- **Tick Marks**: \(10^1, 10^2, 10^3\).
- **Y-axis (ρ)**:
- **Label**: "ρ" (Greek letter rho).
- **Range**: \(10^{-5}\) to \(10^{-3}\).
- **Tick Marks**: \(10^{-5}, 10^{-4}, 10^{-3}\).
3. **Data Points**:
- **Color**: Blue.
- **Coordinates**:
- \((10, 10^{-4})\)
- \((100, 10^{-4.5})\)
- \((1000, 10^{-5})\)
- **Trend**: Data points align closely with the red trend line, suggesting a strong correlation.
4. **Trend Line**:
- **Color**: Red.
- **Slope**: Negative (downward trajectory).
- **Equation**: Implied power-law relationship:
\[
\rho \propto \tau^{-0.5}
\]
(Derived from the log-log scale and slope of the line.)
5. **Legend**:
- **Status**: No explicit legend present.
- **Inference**:
- Red line = Trend line.
- Blue points = Observed data.
---
### Spatial Grounding
- **Legend Placement**: Not applicable (no legend).
- **Data Point Colors**:
- Blue points match the inferred "data" category.
- Red line matches the inferred "trend" category.
---
### Trend Verification
- **Visual Trend**:
- The red line slopes **downward** on the log-log plot, indicating an inverse relationship between τ and ρ.
- Data points follow the trend line closely, confirming a consistent power-law decay.
---
### Component Isolation
1. **Header**:
- Contains only the title "FreeLaw".
2. **Main Chart**:
- Scatter plot with log-log axes, data points, and trend line.
3. **Footer**:
- No additional text or components.
---
### Data Table Reconstruction
No explicit data table is present. However, the coordinates of the data points can be reconstructed as:
| τ (x-axis) | ρ (y-axis) |
|------------|------------|
| \(10^1\) | \(10^{-4}\) |
| \(10^2\) | \(10^{-4.5}\) |
| \(10^3\) | \(10^{-5}\) |
---
### Language and Transcription
- **Primary Language**: English.
- **No Other Languages Detected**.
---
### Summary
The plot demonstrates a **power-law decay** of ρ with respect to τ, governed by the equation \(\rho \propto \tau^{-0.5}\). The red trend line and blue data points confirm this relationship, with no deviations observed. The absence of a legend simplifies interpretation but requires explicit labeling of components.