## Bayesian Network Diagram
### Overview
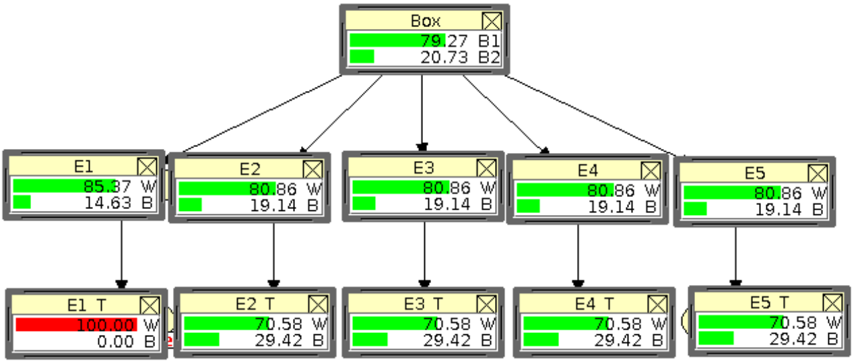
The image depicts a Bayesian network diagram, illustrating probabilistic relationships between variables. The network consists of nodes labeled "Box", "E1" through "E5", and "E1 T" through "E5 T". Each node displays probabilities associated with different states, represented by numerical values and colored bars (green and red). Arrows indicate the direction of influence between nodes.
### Components/Axes
* **Nodes:** Rectangular boxes representing variables. Each node has a label (e.g., "Box", "E1", "E2 T").
* **Probabilities:** Numerical values within each node, representing the probability of each state. These are displayed as percentages.
* **States:** Each node has two states, labeled "W" and "B" or "B1" and "B2". The probabilities of these states sum to 100% within each node.
* **Colored Bars:** Green and red bars visually represent the probabilities of the states. The length of the bar corresponds to the probability value.
* **Arrows:** Directed arrows connecting nodes, indicating the direction of probabilistic influence.
### Detailed Analysis or ### Content Details
**Top-Level Node:**
* **Box:**
* B1: 79.27% (Green bar)
* B2: 20.73% (Red bar)
**Middle-Level Nodes:**
* **E1:**
* W: 85.37% (Green bar)
* B: 14.63% (Red bar)
* **E2:**
* W: 80.86% (Green bar)
* B: 19.14% (Red bar)
* **E3:**
* W: 80.86% (Green bar)
* B: 19.14% (Red bar)
* **E4:**
* W: 80.86% (Green bar)
* B: 19.14% (Red bar)
* **E5:**
* W: 80.86% (Green bar)
* B: 19.14% (Red bar)
**Bottom-Level Nodes:**
* **E1 T:**
* W: 100.00% (Red bar)
* B: 0.00% (Green bar)
* **E2 T:**
* W: 70.58% (Green bar)
* B: 29.42% (Red bar)
* **E3 T:**
* W: 70.58% (Green bar)
* B: 29.42% (Red bar)
* **E4 T:**
* W: 70.58% (Green bar)
* B: 29.42% (Red bar)
* **E5 T:**
* W: 70.58% (Green bar)
* B: 29.42% (Red bar)
### Key Observations
* The "Box" node influences all "E1" through "E5" nodes.
* The "E1" through "E5" nodes influence the "E1 T" through "E5 T" nodes, respectively.
* The probabilities for state "W" are relatively high in nodes "E1" through "E5".
* Node "E1 T" has a 100% probability for state "W".
* Nodes "E2 T" through "E5 T" have identical probability distributions.
### Interpretation
The Bayesian network models the probabilistic dependencies between a root node "Box" and subsequent nodes "E1" through "E5", and then "E1 T" through "E5 T". The probabilities associated with each node represent the likelihood of the variable being in a particular state ("W" or "B"). The network suggests that the state of the "Box" node influences the states of "E1" through "E5", which in turn influence the states of "E1 T" through "E5 T". The 100% probability of state "W" in "E1 T" indicates a deterministic relationship or a strong influence from its parent node "E1". The identical probability distributions in "E2 T" through "E5 T" suggest a similar influence from their respective parent nodes. The diagram could represent a system where the "Box" node represents an initial condition, the "E" nodes represent intermediate events, and the "E T" nodes represent final outcomes.