\n
## Diagram: Hierarchical Box and Element Distribution
### Overview
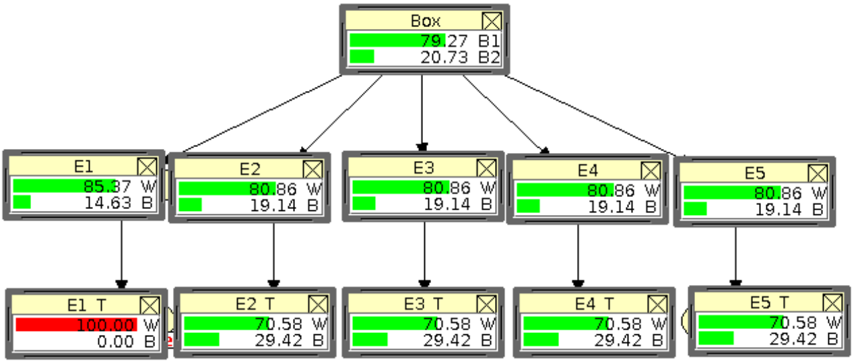
The image depicts a hierarchical diagram representing a "Box" divided into five "E" elements (E1-E5), each further divided into a "T" sub-element. Each box displays two numerical values labeled "W" and "B", along with a percentage. The diagram illustrates a cascading distribution of values from the top-level "Box" down to the lowest-level "T" elements.
### Components/Axes
The diagram consists of:
* **Box:** The top-level container.
* **E1-E5:** Five intermediate elements branching from the "Box".
* **E1 T - E5 T:** Five sub-elements branching from E1-E5.
* **Labels:** "W" and "B" representing two components of the values.
* **Numerical Values:** Percentages associated with "W" and "B" within each box.
* **Connectors:** Lines indicating the hierarchical relationships between boxes.
* **Icons:** Small "X" icons within each box, likely representing a control or status indicator.
### Detailed Analysis
The diagram shows a hierarchical breakdown of values. Let's analyze each level:
**Box:**
* 79.27 W
* 20.73 B
**E1:**
* 85.37 W
* 14.63 B
**E2:**
* 80.86 W
* 19.14 B
**E3:**
* 80.86 W
* 19.14 B
**E4:**
* 80.86 W
* 19.14 B
**E5:**
* 80.86 W
* 19.14 B
**E1 T:**
* 100.00 W
* 0.00 B
**E2 T:**
* 70.58 W
* 29.42 B
**E3 T:**
* 70.58 W
* 29.42 B
**E4 T:**
* 70.58 W
* 29.42 B
**E5 T:**
* 70.58 W
* 29.42 B
### Key Observations
* The "Box" has a relatively high proportion of "W" (79.27%) and a low proportion of "B" (20.73%).
* The "E" elements (E1-E5) have a "W" proportion ranging from 80.86% to 85.37% and "B" proportion ranging from 14.63% to 19.14%.
* The "T" elements show a more varied distribution. E1 T is entirely "W" (100.00%), while E2-E5 T have a "W" proportion of 70.58% and a "B" proportion of 29.42%.
* E1 stands out as having the highest "W" proportion among the "E" elements and its "T" element is exclusively "W".
* E2, E3, E4, and E5 have identical "W" and "B" proportions.
### Interpretation
This diagram likely represents a distribution or allocation process. The "Box" represents a total quantity, and the "E" and "T" elements represent subdivisions of that quantity. The "W" and "B" values could represent different categories or components within the total.
The diagram suggests that the initial allocation (from the "Box" to the "E" elements) maintains a relatively consistent proportion of "W" and "B". However, the further allocation (from the "E" elements to the "T" elements) introduces significant variation. E1 is fully allocated to "W", while the other elements have a more balanced distribution.
This could indicate a selective process where "W" is preferentially allocated to E1, or a specific requirement for E1 to be entirely composed of "W". The consistent values for E2-E5 T suggest a standardized allocation process for those elements. The diagram is a visual representation of a hierarchical breakdown of a resource or quantity, highlighting the distribution of two components ("W" and "B") across different levels of the hierarchy.