## Hierarchical Diagram: System Component Breakdown
### Overview
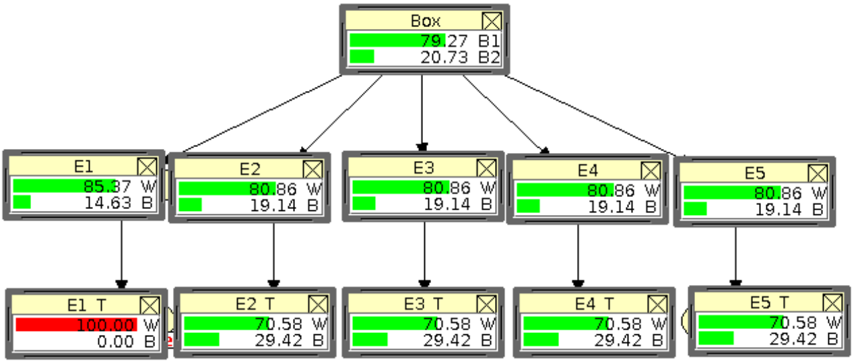
The image depicts a hierarchical structure with a central "Box" node connected to five subordinate nodes (E1–E5), each linked to a terminal node (E1 T–E5 T). Arrows indicate directional relationships, and numerical values with units (W, B) are displayed in colored bars. The diagram uses green and red bars to differentiate data categories.
### Components/Axes
- **Central Node**: Labeled "Box" with two values:
- **79.27 B1** (green bar)
- **20.73 B2** (green bar)
- **Subordinate Nodes (E1–E5)**:
- Each has two values (W and B) in green bars.
- Example: E1 = 85.37 W, 14.63 B.
- **Terminal Nodes (E1 T–E5 T)**:
- Each has two values (W and B) in colored bars.
- E1 T uses a red bar for W (100.00 W) and a green bar for B (0.00 B).
- Other terminal nodes use green bars for both W and B.
### Detailed Analysis
- **Box Node**:
- B1 (79.27) dominates B2 (20.73), suggesting a primary component.
- **E1–E5 Nodes**:
- W values range from 80.86–85.37.
- B values range from 14.63–19.14.
- **Terminal Nodes**:
- E1 T: W = 100.00 (red), B = 0.00 (green).
- E2–E5 T: W = 70.58, B = 29.42 (consistent across all).
### Key Observations
1. **Color Coding**:
- Red bar in E1 T’s W value (100.00) stands out as an outlier.
- Green bars dominate other nodes, indicating uniformity.
2. **Value Consistency**:
- E2–E5 T nodes share identical W (70.58) and B (29.42) values.
3. **Hierarchical Flow**:
- Arrows suggest a top-down relationship: Box → E1–E5 → E1 T–E5 T.
### Interpretation
- **System Breakdown**: The diagram likely represents a system where the central "Box" distributes resources or data to five components (E1–E5), which are further processed into terminal nodes (E1 T–E5 T).
- **Anomalies**:
- E1 T’s W value (100.00) is significantly higher than others (70.58), possibly indicating a critical or overloaded state.
- E1 T’s B value (0.00) contrasts with other terminal nodes (29.42), suggesting a unique condition or failure state.
- **Relationships**:
- The central "Box" may represent a source or aggregate, with E1–E5 as intermediate nodes and E1 T–E5 T as final outputs or states.
- The consistent W/B values in E2–E5 T imply standardized processing, while E1 T’s divergence highlights a special case.
### Conclusion
The diagram illustrates a hierarchical system with a central node and five branches, each culminating in a terminal node. The use of color and numerical values emphasizes anomalies (E1 T) and uniformity (E2–E5 T), suggesting a structured yet variable system.