## Scatter Plot: Top-1 Accuracy vs. Representation Size
### Overview
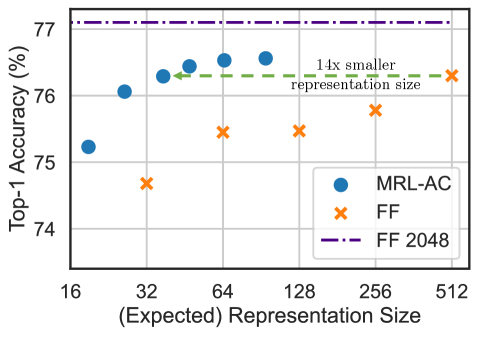
The image is a scatter plot comparing the Top-1 Accuracy (%) of two model types (MRL-AC and FF) across different (Expected) Representation Sizes. A horizontal reference line indicates the performance of a fixed "FF 2048" model. An annotation highlights a key efficiency comparison.
### Components/Axes
* **Chart Type:** Scatter plot with two data series and one horizontal reference line.
* **X-Axis:** Label: "(Expected) Representation Size". Scale: Logarithmic base 2. Major tick marks and labels at: 16, 32, 64, 128, 256, 512.
* **Y-Axis:** Label: "Top-1 Accuracy (%)". Scale: Linear. Major tick marks and labels at: 74, 75, 76, 77.
* **Legend:** Located in the bottom-right quadrant of the plot area.
* Blue circle: "MRL-AC"
* Orange 'x' (cross): "FF"
* Purple dash-dot line: "FF 2048"
* **Annotation:** A green dashed arrow with text. The arrow originates near the "FF" data point at x=512 and points leftward to the "MRL-AC" data point at approximately x=36. The text above the arrow reads: "14x smaller representation size".
### Detailed Analysis
**Data Series 1: MRL-AC (Blue Circles)**
* **Trend:** Accuracy increases with representation size, showing a steep initial rise that plateaus after size 64.
* **Data Points (Approximate):**
* Size 16: ~75.2%
* Size 32: ~76.1%
* Size 64: ~76.5%
* Size 128: ~76.6%
* Size 256: ~76.6%
**Data Series 2: FF (Orange Crosses)**
* **Trend:** Accuracy also increases with representation size but remains consistently below the MRL-AC series for equivalent sizes. The gap narrows at the largest size (512).
* **Data Points (Approximate):**
* Size 32: ~74.7%
* Size 64: ~75.5%
* Size 128: ~75.5%
* Size 256: ~75.8%
* Size 512: ~76.3%
**Reference Line: FF 2048 (Purple Dash-Dot Line)**
* A constant horizontal line at approximately 77.1% accuracy, serving as a high-performance benchmark.
**Annotation Analysis:**
* The green arrow visually connects the "FF" point at size 512 (accuracy ~76.3%) to the "MRL-AC" point at an estimated size of 36 (interpolated between 32 and 64, accuracy ~76.3%).
* The text "14x smaller representation size" quantifies this comparison: 512 / 36 ≈ 14.2.
### Key Observations
1. **Performance Hierarchy:** The "FF 2048" line represents the highest accuracy (~77.1%). For any given representation size below 512, MRL-AC outperforms FF.
2. **Efficiency Crossover:** The annotation highlights the core finding: MRL-AC achieves the same accuracy as FF at a representation size approximately 14 times smaller (size ~36 vs. 512).
3. **Diminishing Returns:** Both MRL-AC and FF show diminishing returns in accuracy gain as representation size increases beyond 64 and 128, respectively.
4. **Convergence at High Size:** At the largest measured size (512), the performance gap between FF (~76.3%) and MRL-AC (~76.6% at size 256) becomes very small.
### Interpretation
This chart demonstrates a significant efficiency advantage for the "MRL-AC" model architecture or method over the "FF" (likely Feed-Forward) baseline. The key takeaway is not just raw performance, but **performance per unit of model size**.
* **The "14x smaller" claim** is the central message. It suggests MRL-AC can match the accuracy of a much larger FF model, implying major savings in memory, computational cost, or energy for deployment.
* **The plateauing curves** indicate that simply increasing model size yields less and less benefit beyond a certain point. The optimal operating point for MRL-AC appears to be around size 64-128, where it achieves near-peak accuracy.
* **The FF 2048 line** sets an upper-bound target. While neither model reaches it within the plotted sizes, MRL-AC gets closer with far fewer parameters. This invites the question: what would MRL-AC's accuracy be at size 2048? The trend suggests it might surpass the FF 2048 benchmark.
* **Underlying Message:** The research likely proposes MRL-AC as a more parameter-efficient alternative to standard feed-forward networks for the task measured (e.g., image classification, given "Top-1 Accuracy"). The chart provides empirical evidence for its superior scaling law.