## Chart Type: Receiver Operating Characteristic (ROC) Curves
### Overview
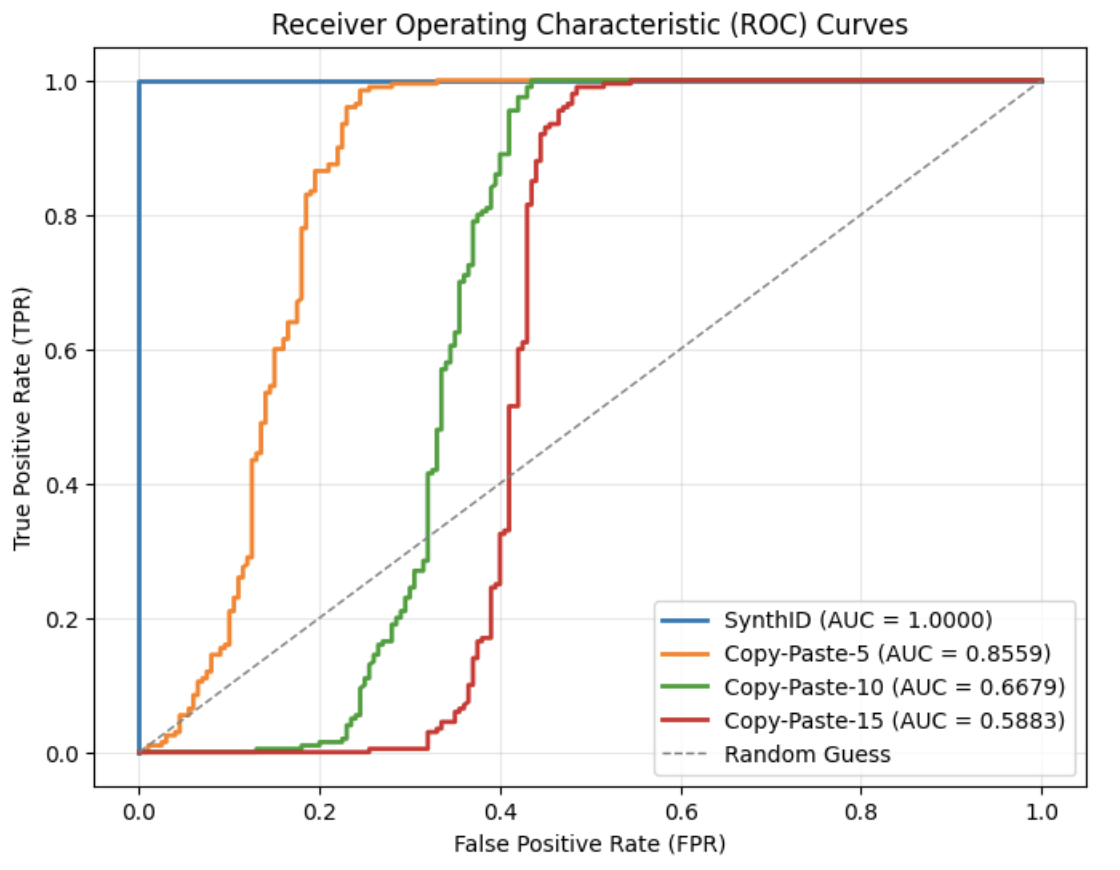
The image is a Receiver Operating Characteristic (ROC) curve chart comparing the performance of different methods: SynthID, Copy-Paste-5, Copy-Paste-10, and Copy-Paste-15, against a random guess baseline. The chart plots the True Positive Rate (TPR) against the False Positive Rate (FPR). The Area Under the Curve (AUC) is provided for each method.
### Components/Axes
* **Title:** Receiver Operating Characteristic (ROC) Curves
* **X-axis:** False Positive Rate (FPR), ranging from 0.0 to 1.0 in increments of 0.2.
* **Y-axis:** True Positive Rate (TPR), ranging from 0.0 to 1.0 in increments of 0.2.
* **Grid:** Light gray grid lines are present.
* **Legend:** Located in the bottom-right corner, the legend identifies each line by method and its corresponding AUC score:
* SynthID (AUC = 1.0000) - Blue line
* Copy-Paste-5 (AUC = 0.8559) - Orange line
* Copy-Paste-10 (AUC = 0.6679) - Green line
* Copy-Paste-15 (AUC = 0.5883) - Red line
* Random Guess - Dashed gray line
### Detailed Analysis
* **SynthID (Blue):** The blue line rises vertically at FPR = 0.0 to TPR = 1.0, then continues horizontally. This indicates perfect classification.
* **Copy-Paste-5 (Orange):** The orange line rises steeply between FPR 0.1 and 0.2, reaching TPR near 1.0 by FPR 0.3.
* **Copy-Paste-10 (Green):** The green line rises more gradually, starting around FPR 0.2 and reaching TPR near 1.0 by FPR 0.5.
* **Copy-Paste-15 (Red):** The red line rises even more gradually, starting around FPR 0.3 and reaching TPR near 1.0 by FPR 0.6.
* **Random Guess (Dashed Gray):** The dashed gray line represents a diagonal line from (0,0) to (1,1), indicating performance equivalent to random guessing.
**Data Points (Approximate):**
* **SynthID (Blue):**
* (0.0, 0.0)
* (0.0, 1.0)
* (1.0, 1.0)
* **Copy-Paste-5 (Orange):**
* (0.0, ~0.01)
* (0.15, ~0.5)
* (0.25, ~0.9)
* (1.0, 1.0)
* **Copy-Paste-10 (Green):**
* (0.0, ~0.01)
* (0.3, ~0.5)
* (0.4, ~0.8)
* (1.0, 1.0)
* **Copy-Paste-15 (Red):**
* (0.0, ~0.01)
* (0.4, ~0.5)
* (0.5, ~0.75)
* (1.0, ~0.95)
* **Random Guess (Dashed Gray):**
* (0.0, 0.0)
* (1.0, 1.0)
### Key Observations
* SynthID has a perfect AUC score of 1.0000, indicating perfect classification.
* The AUC scores decrease as we move from Copy-Paste-5 to Copy-Paste-10 to Copy-Paste-15, suggesting a decline in performance.
* The Random Guess line serves as a baseline; all methods perform better than random guessing.
### Interpretation
The ROC curves illustrate the performance of different methods in distinguishing between positive and negative cases. SynthID demonstrates ideal performance, perfectly separating the two classes. The Copy-Paste methods show varying degrees of effectiveness, with Copy-Paste-5 performing the best among them, and Copy-Paste-15 performing the worst. The AUC values quantify these differences, providing a single metric to compare the methods. The further the curve is from the random guess line (dashed gray), the better the model's performance. The data suggests that as the "Copy-Paste" number increases, the performance decreases.