## ROC Curve: Receiver Operating Characteristic (ROC) Curves
### Overview
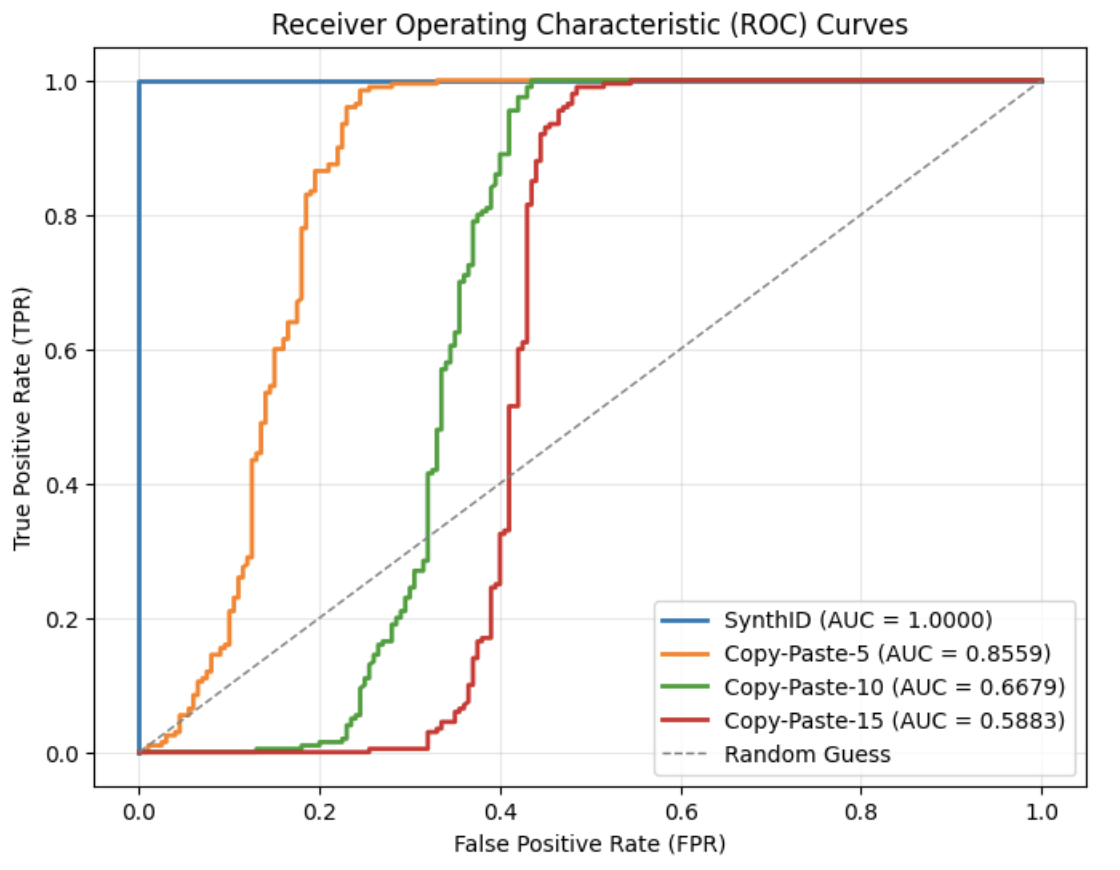
The image displays a Receiver Operating Characteristic (ROC) curve comparing the performance of four classification models: SynthID, Copy-Paste-5, Copy-Paste-10, and Copy-Paste-15, against a random guess baseline. The curves illustrate the trade-off between True Positive Rate (TPR) and False Positive Rate (FPR) for different classification thresholds.
### Components/Axes
- **X-axis**: False Positive Rate (FPR) ranging from 0.0 to 1.0 in increments of 0.2.
- **Y-axis**: True Positive Rate (TPR) ranging from 0.0 to 1.0 in increments of 0.2.
- **Legend**: Located in the bottom-right corner, with the following entries:
- **SynthID (AUC = 1.0000)**: Blue solid line.
- **Copy-Paste-5 (AUC = 0.8559)**: Orange solid line.
- **Copy-Paste-10 (AUC = 0.6679)**: Green solid line.
- **Copy-Paste-15 (AUC = 0.5883)**: Red solid line.
- **Random Guess**: Gray dashed diagonal line (AUC = 0.5 by definition).
### Detailed Analysis
1. **SynthID (Blue Line)**:
- Starts at (0.0, 0.0) and immediately rises vertically to (0.0, 1.0), then horizontally to (1.0, 1.0).
- Perfect classifier with no false positives (FPR = 0.0) and maximum true positives (TPR = 1.0).
- AUC = 1.0000 (ideal performance).
2. **Copy-Paste-5 (Orange Line)**:
- Begins at (0.0, 0.0), rises steeply to ~(0.2, 0.8), then flattens to (1.0, 0.8).
- AUC = 0.8559, indicating strong but imperfect performance.
- TPR plateaus at ~0.8 as FPR increases beyond 0.2.
3. **Copy-Paste-10 (Green Line)**:
- Starts at (0.0, 0.0), rises gradually to ~(0.4, 0.6), then steeply to (1.0, 0.6).
- AUC = 0.6679, showing moderate performance.
- TPR plateaus at ~0.6 as FPR increases beyond 0.4.
4. **Copy-Paste-15 (Red Line)**:
- Begins at (0.0, 0.0), rises slowly to ~(0.6, 0.4), then steeply to (1.0, 0.4).
- AUC = 0.5883, indicating poor performance.
- TPR plateaus at ~0.4 as FPR increases beyond 0.6.
5. **Random Guess (Gray Dashed Line)**:
- Diagonal line from (0.0, 0.0) to (1.0, 1.0), representing a baseline with no discriminative power.
- AUC = 0.5 (expected for random guessing).
### Key Observations
- **SynthID** outperforms all other models, achieving perfect separation between classes.
- **Copy-Paste** models degrade in performance as the number increases (5 → 10 → 15), with AUC dropping from 0.8559 to 0.5883.
- The **Random Guess** line serves as a critical benchmark, confirming that all models except Copy-Paste-15 outperform random chance.
- All curves converge at (1.0, 1.0), reflecting the theoretical maximum TPR when FPR = 1.0.
### Interpretation
The data suggests that **SynthID** is an optimal classifier for this task, while the **Copy-Paste** models exhibit diminishing returns as their configuration complexity increases (e.g., higher numbers). The steep decline in AUC from Copy-Paste-5 to Copy-Paste-15 implies potential overfitting or parameter instability in larger configurations. The **Random Guess** line underscores the importance of AUC as a metric: models with AUC > 0.5 are better than random, but only SynthID achieves near-perfect performance. This analysis highlights the need for careful model selection and threshold tuning in classification tasks.