\n
## Contour Plot: Variable Distribution over Time and Space
### Overview
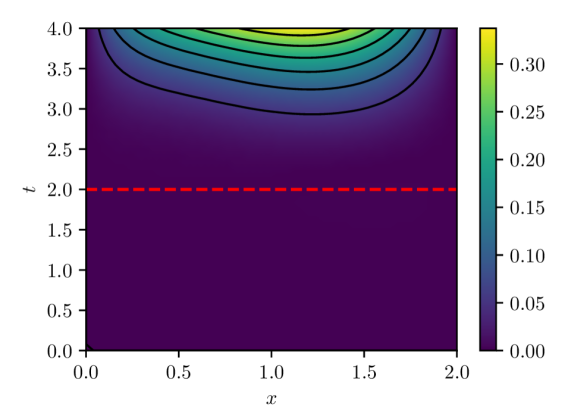
The image presents a contour plot visualizing the distribution of a variable (represented by color) across two dimensions: *x* and *t*. The plot shows how the variable changes as *x* varies from 0.0 to 2.0 and *t* varies from 0.0 to 4.0. A horizontal dashed red line is present at *t* = 2.0. A colorbar on the right indicates the mapping between color and variable value, ranging from 0.00 (dark purple) to 0.30 (yellow).
### Components/Axes
* **X-axis:** Labeled "*x*", ranging from 0.0 to 2.0.
* **Y-axis:** Labeled "*t*", ranging from 0.0 to 4.0.
* **Colorbar:** Located on the right side of the plot. Values range from 0.00 to 0.30, with a gradient from dark purple to yellow.
* **Contour Lines:** Represent constant values of the variable.
* **Horizontal Line:** A dashed red line at *t* = 2.0.
### Detailed Analysis
The contour lines indicate the shape of the variable's distribution. The variable appears to be relatively low (dark purple) for *t* values below approximately 1.5. Above this value, the variable increases, forming a series of contours that peak around *x* = 1.0 and *t* = 3.5, reaching values close to 0.30 (yellow).
Here's an approximate breakdown of the variable values based on the colorbar and contour lines:
* **Low Values (0.00 - 0.05):** Predominant in the region where *t* < 1.5.
* **Moderate Values (0.05 - 0.15):** Found in the region 1.5 < *t* < 2.5 and 0.5 < *x* < 1.5.
* **High Values (0.15 - 0.25):** Present in the region 2.5 < *t* < 3.5 and 0.75 < *x* < 1.25.
* **Peak Values (0.25 - 0.30):** Concentrated around *x* = 1.0 and *t* = 3.5.
The dashed red line at *t* = 2.0 intersects the contour lines, indicating the variable's value at that specific time. Based on the color gradient, the variable's value along this line appears to range from approximately 0.10 to 0.20.
### Key Observations
* The variable's value increases with time (*t*) until it reaches a peak around *t* = 3.5.
* The maximum value of the variable is concentrated around *x* = 1.0.
* The variable is relatively stable for *t* values below 1.5.
* The dashed line at *t* = 2.0 provides a snapshot of the variable's distribution at that specific time.
### Interpretation
This contour plot likely represents the evolution of a physical quantity over time and space. The increasing variable values with time suggest a growth or accumulation process. The peak around *x* = 1.0 could indicate a region of maximum activity or concentration. The dashed line at *t* = 2.0 might represent a critical time point or a specific condition being investigated.
Without further context, it's difficult to determine the exact meaning of the variable and the underlying physical process. However, the plot provides valuable insights into the spatial and temporal distribution of the variable, allowing for qualitative and potentially quantitative analysis. The shape of the contours suggests a diffusion-like process, where the variable spreads out over time and reaches a maximum concentration in a specific region. The horizontal line could be a boundary condition or a point of interest for further investigation.