## Line Graphs: vNMSE vs Dimension d for TurboQuantMSE and EDEN-biased
### Overview
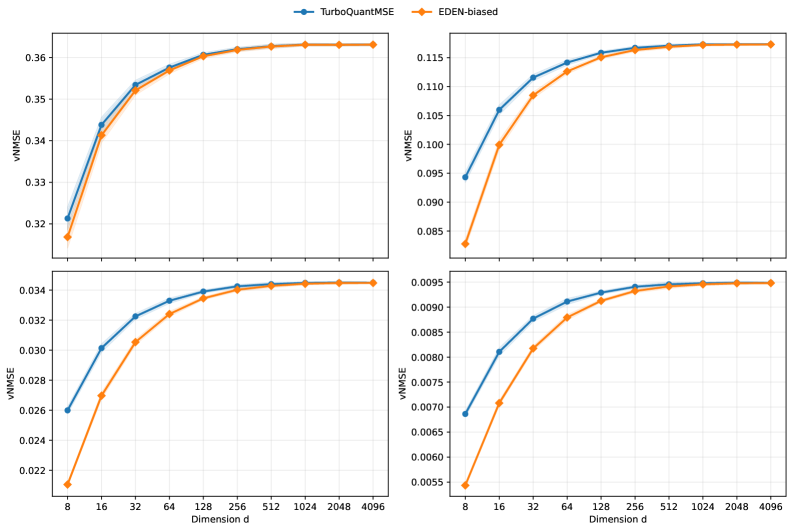
The image contains four line graphs arranged in a 2x2 grid, comparing the vNMSE (Variance of Normalized Mean Squared Error) performance of two methods: **TurboQuantMSE** (blue line) and **EDEN-biased** (orange line) across different dimensions (d). Each graph represents a distinct scenario or parameter setting, with y-axis ranges varying by graph.
---
### Components/Axes
- **X-axis**: Labeled "Dimension d", with values: 8, 16, 32, 64, 128, 256, 512, 1024, 2048, 4096 (exponential scaling).
- **Y-axis**: Labeled "vNMSE", with ranges specific to each graph:
- Top-left: 0.32–0.36
- Top-right: 0.085–0.115
- Bottom-left: 0.022–0.034
- Bottom-right: 0.0055–0.0095
- **Legends**: Positioned at the top of each graph. Blue = TurboQuantMSE, Orange = EDEN-biased.
---
### Detailed Analysis
#### Top-left Graph (y-axis: 0.32–0.36)
- **Trend**: Both lines start near 0.32 at d=8. TurboQuantMSE (blue) rises sharply to ~0.36 by d=16, while EDEN-biased (orange) increases more gradually, reaching ~0.355 by d=4096. The gap narrows as d increases.
- **Key Points**:
- d=8: TurboQuantMSE ≈ 0.322, EDEN-biased ≈ 0.315
- d=4096: Both ≈ 0.36
#### Top-right Graph (y-axis: 0.085–0.115)
- **Trend**: TurboQuantMSE starts at ~0.095 (d=8) and rises to ~0.115 (d=4096). EDEN-biased begins lower (~0.085) and converges to ~0.114 by d=4096.
- **Key Points**:
- d=8: TurboQuantMSE ≈ 0.095, EDEN-biased ≈ 0.085
- d=4096: TurboQuantMSE ≈ 0.115, EDEN-biased ≈ 0.114
#### Bottom-left Graph (y-axis: 0.022–0.034)
- **Trend**: TurboQuantMSE starts at ~0.026 (d=8) and increases to ~0.034 (d=4096). EDEN-biased begins lower (~0.022) and rises to ~0.033 by d=4096.
- **Key Points**:
- d=8: TurboQuantMSE ≈ 0.026, EDEN-biased ≈ 0.022
- d=4096: TurboQuantMSE ≈ 0.034, EDEN-biased ≈ 0.033
#### Bottom-right Graph (y-axis: 0.0055–0.0095)
- **Trend**: TurboQuantMSE starts at ~0.0065 (d=8) and rises to ~0.0095 (d=4096). EDEN-biased begins lower (~0.0055) and converges to ~0.0094 by d=4096.
- **Key Points**:
- d=8: TurboQuantMSE ≈ 0.0065, EDEN-biased ≈ 0.0055
- d=4096: TurboQuantMSE ≈ 0.0095, EDEN-biased ≈ 0.0094
---
### Key Observations
1. **Consistent Performance Gap**: TurboQuantMSE consistently exhibits higher vNMSE than EDEN-biased at lower dimensions (d=8–32), but the gap diminishes as d increases.
2. **Convergence at High Dimensions**: By d=4096, the vNMSE values of both methods are nearly identical across all graphs, suggesting similar performance in high-dimensional spaces.
3. **Scaling Behavior**: Both methods show increasing vNMSE with dimension, but TurboQuantMSE’s growth is more pronounced at lower dimensions.
---
### Interpretation
- **Method Comparison**: TurboQuantMSE may incur higher initial errors or computational costs at lower dimensions, while EDEN-biased performs better in these regimes. However, both methods converge in high-dimensional settings, indicating comparable effectiveness for large-scale problems.
- **Dimensionality Impact**: The graphs highlight the importance of dimension in algorithm selection. For low-dimensional tasks, EDEN-biased might be preferable, but TurboQuantMSE could be viable for high-dimensional applications where the performance gap closes.
- **Anomalies**: No outliers are observed; trends are smooth and consistent across all graphs. The convergence suggests that both methods stabilize in high-dimensional regimes, though TurboQuantMSE’s initial disadvantage persists until d=4096.