## Image Segmentation and Analysis Workflow
### Overview
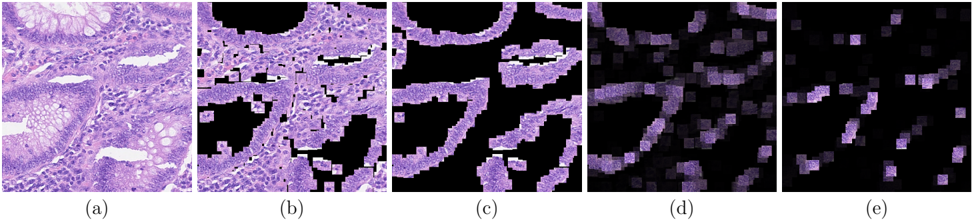
The image displays a five-panel sequence illustrating progressive stages of medical image processing, likely for tissue or cellular analysis. Each panel represents a distinct computational step, with increasing abstraction from raw imagery to feature extraction.
### Components/Axes
- **Panel Labels**: (a) through (e), sequentially ordered left to right.
- **No explicit textual labels, axis titles, legends, or axis markers** are visible in the image.
- **Color Coding**:
- **Panel (a)**: Dominant purple hues with white regions (likely original stained tissue sample).
- **Panel (b)**: Black-and-white segmentation mask overlaying (a), isolating specific structures.
- **Panel (c)**: Simplified binary mask derived from (b), retaining only critical anatomical outlines.
- **Panel (d)**: Gradient-based feature map highlighting intensity variations.
- **Panel (e)**: Sparse, localized feature activation map (e.g., nuclei or cellular markers).
### Detailed Analysis
1. **Panel (a)**:
- High-resolution histological image with nuclei (dark purple) and extracellular matrix (lighter purple).
- No discernible text or annotations.
2. **Panel (b)**:
- Binary segmentation mask (white regions) applied to (a), delineating cellular boundaries.
- Artifacts suggest automated thresholding or edge-detection algorithms.
3. **Panel (c)**:
- Simplified mask from (b), reduced to polygonal outlines of major structures.
- Loss of fine detail compared to (b), indicating dimensionality reduction.
4. **Panel (d)**:
- Gradient magnitude map (dark-to-light purple) emphasizing edges and texture gradients.
- No numerical scale or units provided.
5. **Panel (e)**:
- Sparse activation map (bright purple spots) likely representing nuclei or specific biomarkers.
- Spatial resolution appears coarser than (a), suggesting downsampling.
### Key Observations
- **Progressive Abstraction**: Each panel reduces spatial and textural complexity, transitioning from raw data to actionable features.
- **No Numerical Data**: No quantitative values, scales, or statistical annotations are visible.
- **Color Consistency**: Purple dominates all panels, likely representing tissue staining (e.g., hematoxylin-eosin).
### Interpretation
This workflow demonstrates a pipeline for automated pathology analysis:
1. **Original Imaging (a)**: Captures histological detail but requires manual interpretation.
2. **Segmentation (b–c)**: Automates tissue structure identification, critical for quantitative analysis.
3. **Feature Extraction (d–e)**: Reduces data to key biomarkers or morphological markers for downstream tasks (e.g., cancer detection).
**Notable Limitations**:
- Lack of scale bars or calibration data hinders quantitative interpretation.
- No ground-truth annotations to validate segmentation accuracy.
**Clinical Relevance**:
Such pipelines enable high-throughput analysis of tissue samples, reducing reliance on manual pathology reviews. The transition from (a) to (e) mirrors the shift from diagnostic imaging to AI-driven predictive modeling.