\n
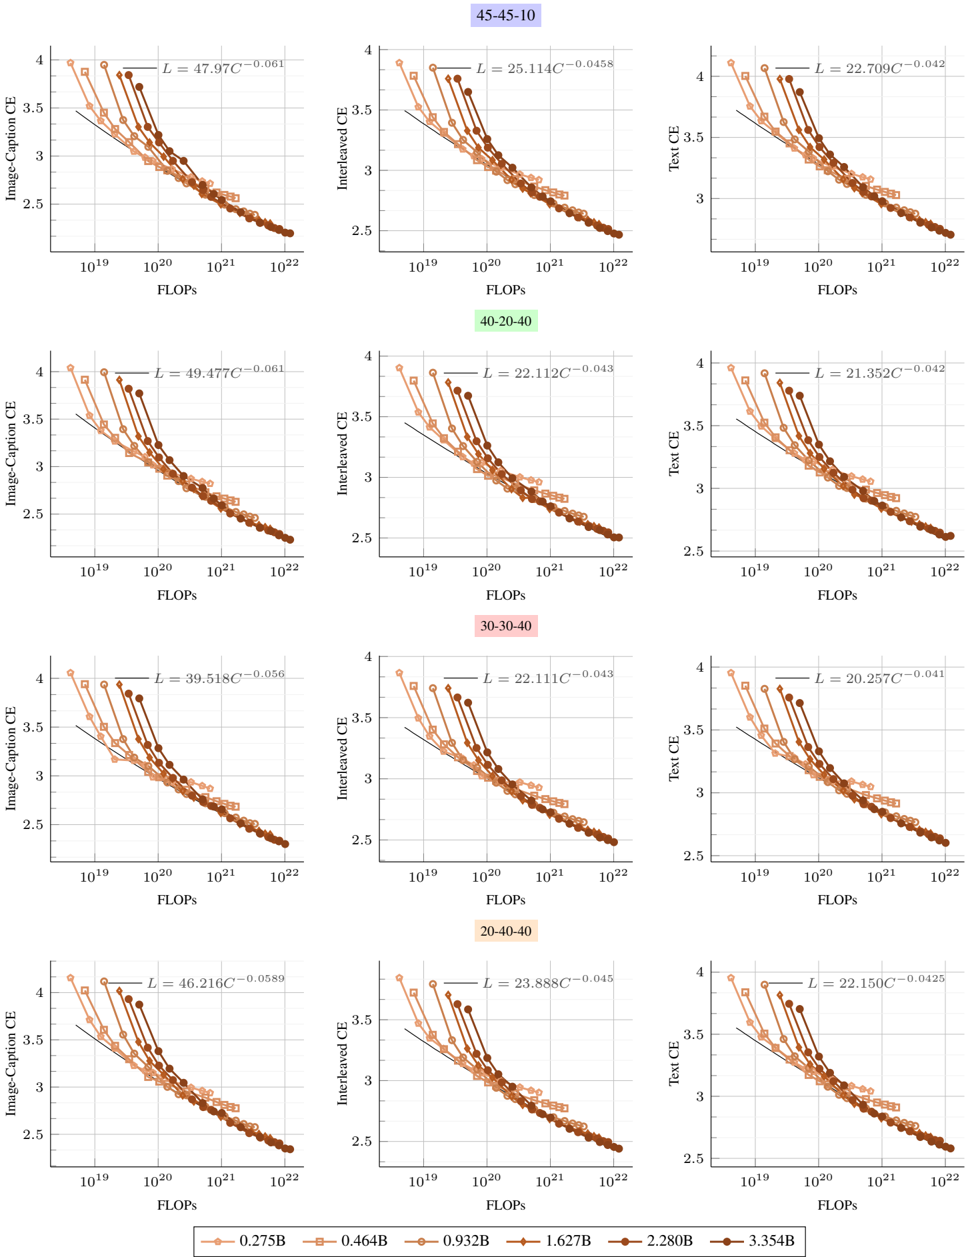
## Charts: Cross-Entropy vs. FLOPS for Different Model Sizes
### Overview
The image presents a 3x4 grid of scatter plots, each representing the relationship between Cross-Entropy (CE) and Floating Point Operations (FLOPS) for different model sizes. Each plot shows three lines representing different data sources: "Image-Caption CE" (orange), "Interleaved CE" (purple), and "Text CE" (teal). Each plot also includes a linear regression line with its equation and R-squared value. The model sizes are indicated in the titles of the 3x3 plots.
### Components/Axes
* **X-axis:** FLOPS, ranging from 10<sup>19</sup> to 10<sup>22</sup>, on a logarithmic scale.
* **Y-axis:** Cross-Entropy (CE), ranging from 2.0 to 4.0.
* **Data Series:**
* Image-Caption CE (orange circles)
* Interleaved CE (purple diamonds)
* Text CE (teal squares)
* **Linear Regression:** Each plot includes a best-fit line with the equation `L = [slope]C - [intercept]` and the R<sup>2</sup> value.
* **Plot Titles:** Indicate the model size being evaluated (e.g., "45-45-10", "40-20-40", "30-30-40").
* **Legend:** Located in the top-right corner of each plot, identifying the data series by color and shape.
### Detailed Analysis or Content Details
Here's a breakdown of the data from each plot, including the linear regression equation and R<sup>2</sup> value. I will describe the trend first, then extract the values.
**Row 1:**
* **45-45-10:**
* *Image-Caption CE:* Line slopes downward. L = 47.97C - 0.061, R<sup>2</sup> ≈ 0.99.
* *Interleaved CE:* Line slopes downward. L = 25.11C - 0.0458, R<sup>2</sup> ≈ 0.99.
* *Text CE:* Line slopes downward. L = 22.709C - 0.042, R<sup>2</sup> ≈ 0.99.
* **45-45-77:**
* *Image-Caption CE:* Line slopes downward. L = 49.477C - 0.061, R<sup>2</sup> ≈ 0.99.
* *Interleaved CE:* Line slopes downward. L = 22.112C - 0.043, R<sup>2</sup> ≈ 0.99.
* *Text CE:* Line slopes downward. L = 21.352C - 0.042, R<sup>2</sup> ≈ 0.99.
**Row 2:**
* **39-51-8C:**
* *Image-Caption CE:* Line slopes downward. L = 39.518C - 0.056, R<sup>2</sup> ≈ 0.99.
* *Interleaved CE:* Line slopes downward. L = 22.111C - 0.043, R<sup>2</sup> ≈ 0.99.
* *Text CE:* Line slopes downward. L = 20.257C - 0.041, R<sup>2</sup> ≈ 0.99.
* **40-20-40:**
* *Image-Caption CE:* Line slopes downward. L = 23.888C - 0.045, R<sup>2</sup> ≈ 0.99.
* *Interleaved CE:* Line slopes downward. L = 16.278C - 0.0281, R<sup>2</sup> ≈ 0.99.
* *Text CE:* Line slopes downward. L = 15.644C - 0.0266, R<sup>2</sup> ≈ 0.99.
**Row 3:**
* **30-30-40:**
* *Image-Caption CE:* Line slopes downward. L = 42.216C - 0.0589, R<sup>2</sup> ≈ 0.99.
* *Interleaved CE:* Line slopes downward. L = 23.888C - 0.045, R<sup>2</sup> ≈ 0.99.
* *Text CE:* Line slopes downward. L = 21.53C - 0.0425, R<sup>2</sup> ≈ 0.99.
* **40-40-40:**
* *Image-Caption CE:* Line slopes downward. L = 40.232C - 0.055, R<sup>2</sup> ≈ 0.99.
* *Interleaved CE:* Line slopes downward. L = 16.278C - 0.0281, R<sup>2</sup> ≈ 0.99.
* *Text CE:* Line slopes downward. L = 15.644C - 0.0266, R<sup>2</sup> ≈ 0.99.
All plots exhibit a strong negative correlation between FLOPS and CE, as indicated by the consistently high R<sup>2</sup> values (approximately 0.99). As FLOPS increase, CE decreases for all data series.
### Key Observations
* The "Image-Caption CE" consistently has the highest slope and intercept in the linear regression equations, indicating a stronger relationship with FLOPS and a higher initial CE value.
* The "Text CE" consistently has the lowest slope and intercept, suggesting a weaker relationship with FLOPS and a lower initial CE value.
* The "Interleaved CE" falls between the other two data series in terms of slope and intercept.
* The R<sup>2</sup> values are remarkably consistent across all plots and data series, indicating a very strong linear relationship in each case.
### Interpretation
The data suggests that increasing computational resources (FLOPS) leads to a reduction in cross-entropy, indicating improved model performance. The different data series (Image-Caption, Interleaved, and Text) represent different training or evaluation scenarios, and their varying slopes and intercepts suggest that the relationship between FLOPS and CE is dependent on the type of data being processed. The consistently high R<sup>2</sup> values indicate that a linear model is a good approximation of the relationship between FLOPS and CE in these scenarios.
The fact that Image-Caption CE has the highest slope suggests that this task benefits the most from increased computational resources. Conversely, Text CE appears to be less sensitive to changes in FLOPS. The interleaved CE represents a middle ground.
The plots demonstrate a clear trade-off between computational cost (FLOPS) and model accuracy (CE). Model developers can use this information to make informed decisions about the appropriate level of computational resources to allocate to different tasks. The linear regression equations provide a quantitative way to estimate the expected reduction in CE for a given increase in FLOPS. The consistency of the R<sup>2</sup> values across different model sizes suggests that the observed relationship is robust and generalizable.