## Chart/Diagram Type: Multi-Chart Analysis
### Overview
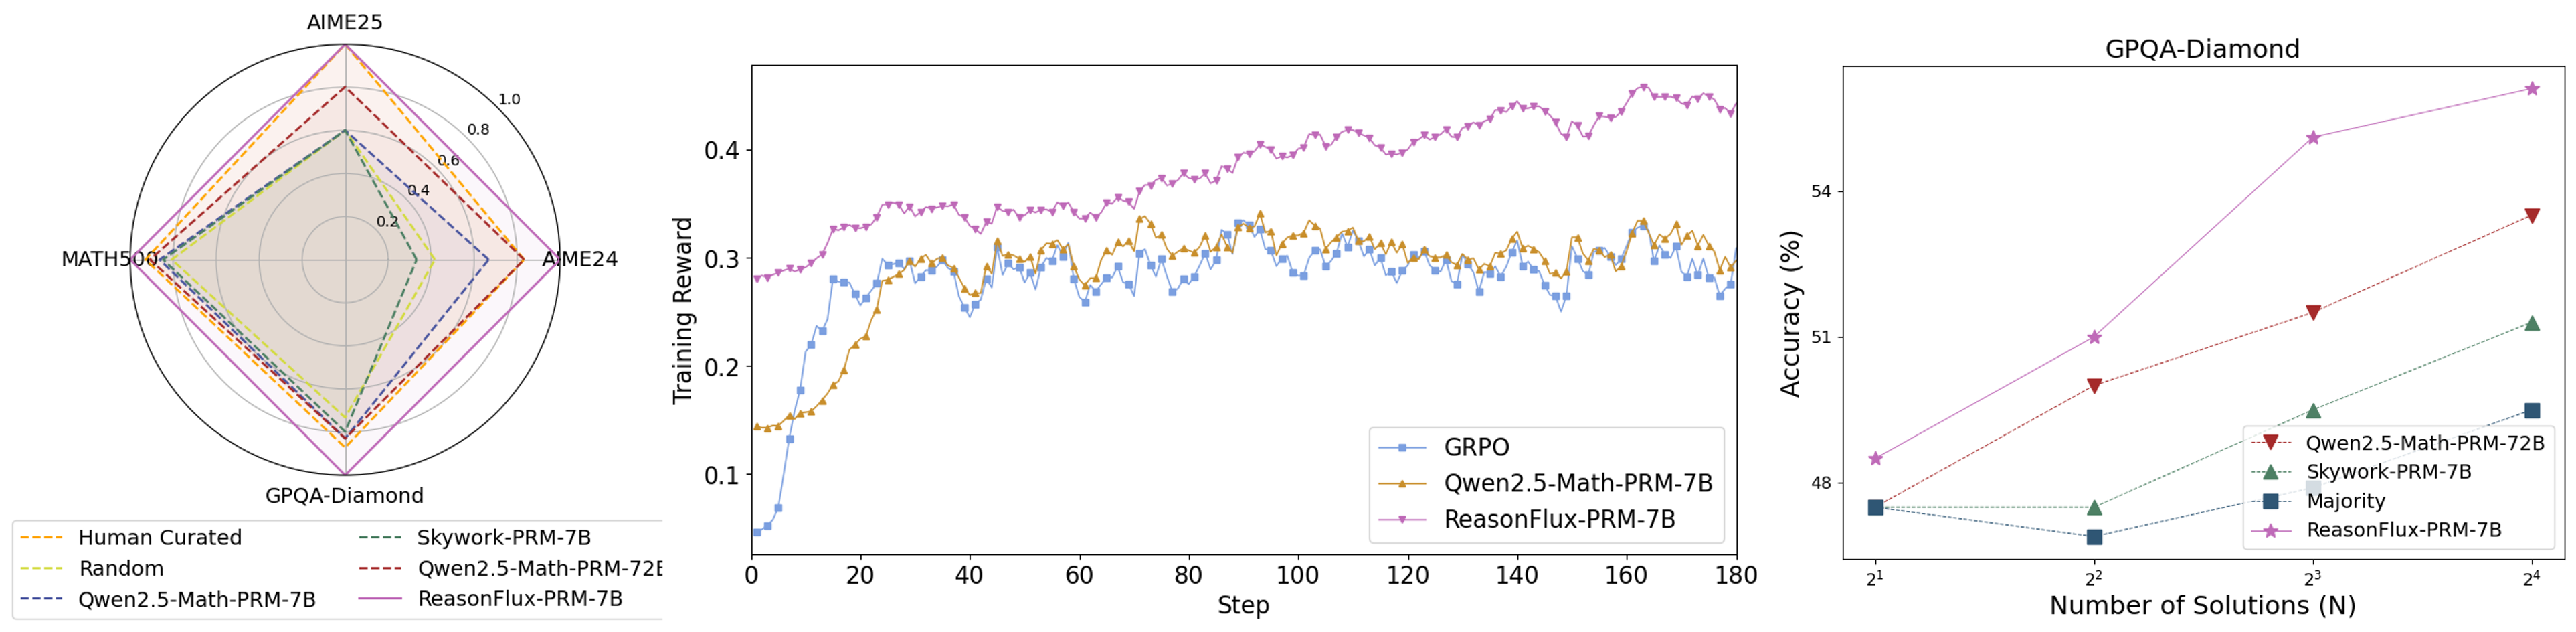
The image presents three charts comparing the performance of different models on various tasks. The first chart is a radar plot showing performance on AIME25, MATH500, AIME24, and GPQA-Diamond. The second chart is a line plot showing the training reward over steps for GRPO, Qwen2.5-Math-PRM-7B, and ReasonFlux-PRM-7B. The third chart is a line plot showing accuracy (%) vs. Number of Solutions (N) for GPQA-Diamond, Qwen2.5-Math-PRM-72B, Skywork-PRM-7B, Majority, and ReasonFlux-PRM-7B.
### Components/Axes
**Chart 1: Radar Plot**
* **Title:** (Implied) Model Performance Comparison
* **Axes:**
* AIME25 (Top)
* MATH500 (Left)
* AIME24 (Right)
* GPQA-Diamond (Bottom)
* **Scale:** 0.0 to 1.0 in increments of 0.2.
* **Legend (Bottom-Left):**
* Human Curated (Yellow, dashed)
* Random (Light Green, dashed)
* Qwen2.5-Math-PRM-7B (Blue, dashed)
* Skywork-PRM-7B (Dark Green, dashed)
* Qwen2.5-Math-PRM-72E (Dark Red, dashed)
* ReasonFlux-PRM-7B (Purple, solid)
**Chart 2: Line Plot (Training Reward)**
* **Title:** (Implied) Training Reward vs. Step
* **X-axis:** Step (0 to 180 in increments of 20)
* **Y-axis:** Training Reward (0.1 to 0.4 in increments of 0.1)
* **Legend (Bottom-Right):**
* GRPO (Blue, square markers)
* Qwen2.5-Math-PRM-7B (Yellow/Orange, triangle markers)
* ReasonFlux-PRM-7B (Purple, triangle markers)
**Chart 3: Line Plot (Accuracy)**
* **Title:** GPQA-Diamond
* **X-axis:** Number of Solutions (N), logarithmic scale (2^1, 2^2, 2^3, 2^4)
* **Y-axis:** Accuracy (%) (48 to 54 in increments of 2)
* **Legend (Bottom-Right):**
* Qwen2.5-Math-PRM-72B (Dark Red, inverted triangle markers)
* Skywork-PRM-7B (Dark Green, triangle markers)
* Majority (Dark Blue, square markers)
* ReasonFlux-PRM-7B (Purple, star markers)
### Detailed Analysis or ### Content Details
**Chart 1: Radar Plot**
* **Human Curated (Yellow, dashed):** Values are approximately 0.4 for AIME25, 0.2 for MATH500, 0.4 for AIME24, and 0.2 for GPQA-Diamond.
* **Random (Light Green, dashed):** Values are approximately 0.2 for all axes.
* **Qwen2.5-Math-PRM-7B (Blue, dashed):** Values are approximately 0.4 for AIME25, 0.2 for MATH500, 0.4 for AIME24, and 0.2 for GPQA-Diamond.
* **Skywork-PRM-7B (Dark Green, dashed):** Values are approximately 0.4 for AIME25, 0.2 for MATH500, 0.4 for AIME24, and 0.2 for GPQA-Diamond.
* **Qwen2.5-Math-PRM-72E (Dark Red, dashed):** Values are approximately 0.6 for AIME25, 0.2 for MATH500, 0.6 for AIME24, and 0.4 for GPQA-Diamond.
* **ReasonFlux-PRM-7B (Purple, solid):** Values are approximately 0.8 for AIME25, 0.4 for MATH500, 0.8 for AIME24, and 0.6 for GPQA-Diamond.
**Chart 2: Line Plot (Training Reward)**
* **GRPO (Blue, square markers):** Starts at approximately 0.1, increases to around 0.3 by step 40, then fluctuates between 0.28 and 0.32 for the remaining steps.
* **Qwen2.5-Math-PRM-7B (Yellow/Orange, triangle markers):** Starts at approximately 0.15, increases to around 0.35 by step 40, then fluctuates between 0.3 and 0.35 for the remaining steps.
* **ReasonFlux-PRM-7B (Purple, triangle markers):** Starts at approximately 0.28, increases steadily to approximately 0.42 by step 180.
**Chart 3: Line Plot (Accuracy)**
* **Qwen2.5-Math-PRM-72B (Dark Red, inverted triangle markers):** Starts at approximately 49% at 2^1, increases to approximately 52% at 2^4.
* **Skywork-PRM-7B (Dark Green, triangle markers):** Starts at approximately 48% at 2^1, increases to approximately 51% at 2^4.
* **Majority (Dark Blue, square markers):** Remains relatively constant at approximately 47% across all values of N.
* **ReasonFlux-PRM-7B (Purple, star markers):** Starts at approximately 48% at 2^1, increases to approximately 55% at 2^4.
### Key Observations
* In the radar plot, ReasonFlux-PRM-7B consistently outperforms other models across all tasks.
* In the training reward plot, ReasonFlux-PRM-7B shows a steady increase in reward over steps, while GRPO and Qwen2.5-Math-PRM-7B plateau after an initial increase.
* In the accuracy plot, ReasonFlux-PRM-7B shows the highest accuracy and the most significant increase in accuracy as the number of solutions increases. The Majority model remains relatively constant.
### Interpretation
The data suggests that ReasonFlux-PRM-7B is the most effective model among those compared. It demonstrates superior performance across various tasks (AIME25, MATH500, AIME24, GPQA-Diamond) and exhibits a consistent improvement in training reward over time. Furthermore, its accuracy on the GPQA-Diamond task increases significantly with the number of solutions, indicating a better ability to leverage additional information. The Majority model's constant accuracy suggests it is not effectively utilizing the increasing number of solutions. The other models show varying degrees of improvement, but none match the overall performance of ReasonFlux-PRM-7B.