## Line Chart: Test AUROC vs Temperature
### Overview
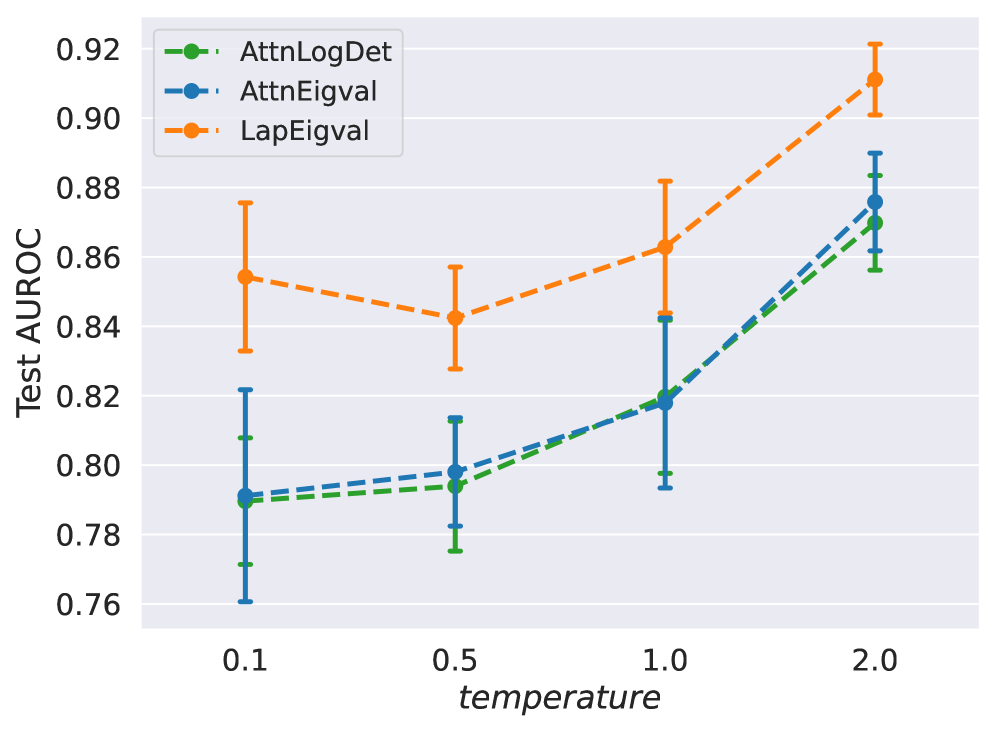
The chart illustrates the relationship between temperature (x-axis) and Test AUROC (y-axis) for three distinct methods: AttnLogDet (green), AttnEigval (blue), and LapEigval (orange). Each method's performance is plotted across four temperature values (0.1, 0.5, 1.0, 2.0), with error bars indicating variability in measurements.
### Components/Axes
- **X-axis (temperature)**: Labeled "temperature" with discrete values at 0.1, 0.5, 1.0, and 2.0.
- **Y-axis (Test AUROC)**: Labeled "Test AUROC" with a scale from 0.76 to 0.92.
- **Legend**: Positioned in the top-left corner, associating:
- Green circles with "AttnLogDet"
- Blue circles with "AttnEigval"
- Orange circles with "LapEigval"
- **Error Bars**: Vertical lines with caps, representing measurement uncertainty for each data point.
### Detailed Analysis
#### Temperature = 0.1
- **AttnLogDet**: ~0.79 (±0.01)
- **AttnEigval**: ~0.79 (±0.02)
- **LapEigval**: ~0.85 (±0.01)
#### Temperature = 0.5
- **AttnLogDet**: ~0.795 (±0.015)
- **AttnEigval**: ~0.80 (±0.02)
- **LapEigval**: ~0.84 (±0.02)
#### Temperature = 1.0
- **AttnLogDet**: ~0.82 (±0.02)
- **AttnEigval**: ~0.82 (±0.03)
- **LapEigval**: ~0.86 (±0.03)
#### Temperature = 2.0
- **AttnLogDet**: ~0.87 (±0.02)
- **AttnEigval**: ~0.88 (±0.03)
- **LapEigval**: ~0.91 (±0.03)
### Key Observations
1. **LapEigval** consistently outperforms the other methods across all temperatures, with the largest gap at 2.0 (~0.91 vs. ~0.87 for AttnLogDet).
2. **AttnEigval** and **AttnLogDet** show nearly identical performance at lower temperatures (0.1–0.5) but diverge slightly at higher temperatures (1.0–2.0).
3. **Error Bars**: LapEigval exhibits the largest variability, particularly at 2.0, where its error range spans ~0.88–0.94. AttnLogDet and AttnEigval have smaller, more consistent error margins.
### Interpretation
The data suggests that increasing temperature improves Test AUROC for all methods, but **LapEigval** demonstrates the most significant performance gains, especially at higher temperatures. However, its larger error bars indicate greater variability, potentially reflecting instability or sensitivity to temperature changes. In contrast, **AttnLogDet** and **AttnEigval** show more stable performance but with smaller improvements. This trade-off between performance and reliability may influence method selection depending on the application's tolerance for variability. The consistent upward trend for all methods implies that temperature is a critical factor in optimizing Test AUROC.