\n
## Line Chart: Symbol Error Rate vs. Pilot Size
### Overview
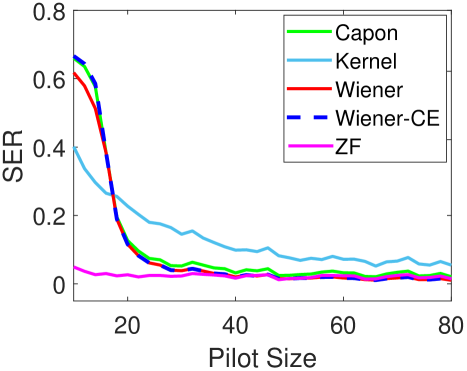
The image presents a line chart illustrating the relationship between Symbol Error Rate (SER) and Pilot Size for five different signal processing techniques: Capon, Kernel, Wiener, Wiener-CE, and Zero-Forcing (ZF). The chart aims to compare the performance of these techniques in terms of SER as the pilot size increases.
### Components/Axes
* **X-axis:** Pilot Size, ranging from approximately 0 to 80. The axis is labeled "Pilot Size".
* **Y-axis:** Symbol Error Rate (SER), ranging from approximately 0 to 0.8. The axis is labeled "SER".
* **Legend:** Located in the top-right corner of the chart. It identifies the five data series with corresponding colors:
* Capon (Green)
* Kernel (Light Blue)
* Wiener (Red)
* Wiener-CE (Dark Blue, dashed line)
* ZF (Magenta)
### Detailed Analysis
Here's a breakdown of each line's trend and approximate data points. Note that values are estimated from the visual representation.
* **Capon (Green):** The line starts at approximately SER = 0.05 at Pilot Size = 0. It initially decreases slightly, then remains relatively stable around SER = 0.02 - 0.05 for Pilot Sizes between 10 and 80.
* **Kernel (Light Blue):** This line exhibits a steep decline from approximately SER = 0.65 at Pilot Size = 0 to approximately SER = 0.1 at Pilot Size = 10. It continues to decrease, leveling off around SER = 0.03 - 0.07 for Pilot Sizes between 40 and 80.
* **Wiener (Red):** The line shows a rapid decrease from approximately SER = 0.65 at Pilot Size = 0 to approximately SER = 0.05 at Pilot Size = 10. It then plateaus, remaining around SER = 0.02 - 0.04 for Pilot Sizes between 20 and 80.
* **Wiener-CE (Dark Blue, dashed):** This line demonstrates a very sharp decline from approximately SER = 0.7 at Pilot Size = 0 to approximately SER = 0.01 at Pilot Size = 10. It remains very low, fluctuating between SER = 0.01 and 0.03 for Pilot Sizes between 10 and 80.
* **ZF (Magenta):** The line starts at approximately SER = 0.02 at Pilot Size = 0 and remains relatively flat, fluctuating between SER = 0.01 and 0.03 throughout the entire range of Pilot Sizes (0 to 80).
### Key Observations
* All techniques show a decrease in SER as Pilot Size increases, indicating improved performance with more pilot symbols.
* Wiener-CE consistently achieves the lowest SER across all Pilot Sizes.
* ZF maintains a very low and stable SER, suggesting robust performance.
* Kernel and Wiener exhibit similar behavior, with a more significant initial decrease in SER followed by a plateau.
* Capon shows the least improvement in SER with increasing Pilot Size.
### Interpretation
The chart demonstrates the effectiveness of different signal processing techniques in mitigating the effects of channel impairments. The rapid decrease in SER for all methods with increasing Pilot Size suggests that providing more known symbols allows for better channel estimation and equalization. Wiener-CE appears to be the most effective technique in this scenario, consistently achieving the lowest SER. The stable performance of ZF indicates its robustness to channel variations. The relatively flat curve of Capon suggests that its performance is less sensitive to Pilot Size compared to other methods. The data suggests that for this particular system, increasing the pilot size beyond a certain point (around 20-40) yields diminishing returns in terms of SER reduction for most techniques. This information is valuable for optimizing the trade-off between pilot overhead and system performance.