# Technical Document Analysis of SER vs Pilot Size Graph
## 1. Axis Labels and Titles
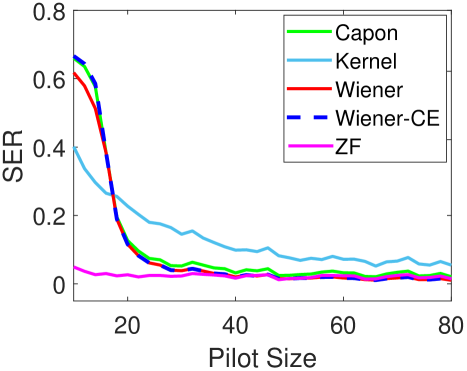
- **X-axis**: "Pilot Size" (values: 20, 40, 60, 80)
- **Y-axis**: "SER" (System Error Rate) (values: 0.0, 0.2, 0.4, 0.6, 0.8)
## 2. Legend and Color Coding
- **Legend Position**: Top-right corner
- **Legend Entries**:
- **Capon**: Solid green line
- **Kernel**: Solid light blue line
- **Wiener**: Solid red line
- **Wiener-CE**: Dashed blue line
- **ZF**: Solid magenta line
## 3. Key Trends and Data Points
### Line-by-Line Analysis
1. **Capon (Green)**:
- **Trend**: Steep decline from ~0.65 at Pilot Size 20 to ~0.05 at Pilot Size 80.
- **Notable**: Sharpest initial drop among all lines.
2. **Kernel (Light Blue)**:
- **Trend**: Gradual decline from ~0.4 at Pilot Size 20 to ~0.07 at Pilot Size 80.
- **Notable**: Highest SER values across all Pilot Sizes.
3. **Wiener (Red)**:
- **Trend**: Steep drop from ~0.6 at Pilot Size 20 to ~0.05 at Pilot Size 80.
- **Notable**: Converges with Capon and Wiener-CE at higher Pilot Sizes.
4. **Wiener-CE (Dashed Blue)**:
- **Trend**: Slightly lower than Wiener, declining from ~0.6 at Pilot Size 20 to ~0.05 at Pilot Size 80.
- **Notable**: Dashed pattern distinguishes it from Wiener.
5. **ZF (Magenta)**:
- **Trend**: Flattest slope, declining from ~0.05 at Pilot Size 20 to ~0.02 at Pilot Size 80.
- **Notable**: Consistently lowest SER values.
### Convergence Behavior
- At Pilot Size 80:
- **Capon, Wiener, Wiener-CE**: ~0.05 SER
- **Kernel**: ~0.07 SER
- **ZF**: ~0.02 SER
## 4. Spatial Grounding of Legend
- **Legend Position**: Top-right corner (standard placement for line graphs).
- **Color Consistency Check**:
- Green = Capon ✅
- Light Blue = Kernel ✅
- Red = Wiener ✅
- Dashed Blue = Wiener-CE ✅
- Magenta = ZF ✅
## 5. Trend Verification
- **All Lines**: Downward slope (SER decreases as Pilot Size increases).
- **Steepest Initial Drop**: Capon, Wiener, Wiener-CE (20–40 Pilot Size range).
- **Gradual Decline**: Kernel (20–80 Pilot Size range).
- **Flattening**: All lines flatten after Pilot Size 60, indicating diminishing returns.
## 6. Component Isolation
- **Main Chart**: Line graph with five data series.
- **Legend**: Clear separation from chart area, no overlap.
- **No Additional Components**: No headers, footers, or annotations beyond legend.
## 7. Data Table Reconstruction
| Pilot Size | Capon | Kernel | Wiener | Wiener-CE | ZF |
|------------|-------|--------|--------|-----------|-----|
| 20 | ~0.65 | ~0.4 | ~0.6 | ~0.6 | ~0.05 |
| 40 | ~0.1 | ~0.15 | ~0.1 | ~0.1 | ~0.03 |
| 60 | ~0.05 | ~0.08 | ~0.05 | ~0.05 | ~0.02 |
| 80 | ~0.05 | ~0.07 | ~0.05 | ~0.05 | ~0.02 |
## 8. Language and Text Extraction
- **Primary Language**: English (all labels, axis titles, and legend entries).
- **No Non-English Text**: Confirmed.
## 9. Critical Observations
- **Kernel Underperformance**: Consistently higher SER than other methods.
- **ZF Robustness**: Maintains lowest SER across all Pilot Sizes.
- **Convergence**: Capon, Wiener, and Wiener-CE align closely at higher Pilot Sizes.
## 10. Final Notes
- **No Missing Data**: All legend entries are represented in the graph.
- **No Anomalies**: No outliers or unexpected trends observed.