## Diagram: State Transformation
### Overview
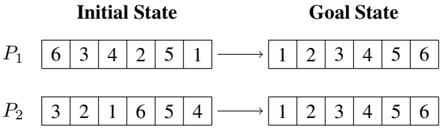
The image illustrates the transformation of two initial states (P1 and P2) into a goal state. Each state is represented as a sequence of numbers within boxes. The diagram shows the initial arrangement of numbers and the desired final arrangement.
### Components/Axes
* **Titles:** "Initial State" (top-left), "Goal State" (top-right)
* **Identifiers:** P1, P2 (left side of each row)
* **States:** Each state is represented by a sequence of six boxes, each containing a number.
* **Arrows:** Arrows indicate the transformation from the initial state to the goal state.
### Detailed Analysis
* **P1 Initial State:** The initial state for P1 is represented by the sequence: 6, 3, 4, 2, 5, 1.
* **P1 Goal State:** The goal state for P1 is represented by the sequence: 1, 2, 3, 4, 5, 6.
* **P2 Initial State:** The initial state for P2 is represented by the sequence: 3, 2, 1, 6, 5, 4.
* **P2 Goal State:** The goal state for P2 is represented by the sequence: 1, 2, 3, 4, 5, 6.
### Key Observations
* Both P1 and P2 start with different initial states.
* Both P1 and P2 converge to the same goal state, which is an ascending sequence from 1 to 6.
### Interpretation
The diagram demonstrates a process where different initial configurations are transformed into a single, ordered goal configuration. This could represent a sorting algorithm, a problem-solving process, or a state transition in a system. The diagram highlights the concept of achieving a desired outcome regardless of the starting point.