## Diagram: Process State Transitions
### Overview
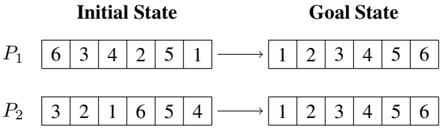
The image depicts two processes (P₁ and P₂) with their **Initial State** and **Goal State** configurations. Each process consists of a sequence of numbers arranged in boxes, transitioning from an unsorted to a sorted order.
### Components/Axes
- **Labels**:
- **Initial State** (left column)
- **Goal State** (right column)
- **Process Identifiers**:
- **P₁** (top row)
- **P₂** (bottom row)
- **Data Structure**:
- Each process has two rows:
- **Initial State**: Unsorted numerical sequence.
- **Goal State**: Sorted numerical sequence (1–6 in ascending order).
### Detailed Analysis
#### Process P₁
- **Initial State**: `[6, 3, 4, 2, 5, 1]`
- **Goal State**: `[1, 2, 3, 4, 5, 6]`
- Transition: Numbers are rearranged to ascending order.
#### Process P₂
- **Initial State**: `[3, 2, 1, 6, 5, 4]`
- **Goal State**: `[1, 2, 3, 4, 5, 6]`
- Transition: Numbers are rearranged to ascending order.
### Key Observations
1. Both processes achieve the **same Goal State** despite different Initial States.
2. The Goal State is a strictly sorted sequence (1–6).
3. No numerical values are repeated in any state.
### Interpretation
The diagram illustrates a **sorting mechanism** or algorithm applied to two distinct initial configurations. The consistent Goal State suggests a deterministic process that transforms any permutation of `[1, 2, 3, 4, 5, 6]` into the sorted order. This could represent:
- A computational sorting algorithm (e.g., bubble sort, selection sort).
- A conceptual model of state normalization in systems engineering.
- A pedagogical example of permutation resolution.
The uniformity of the Goal State implies that the underlying process is robust to variations in the Initial State, emphasizing the importance of standardization in system design or data processing pipelines.