## Light Curve Analysis: KMT-2017-BLG-0428
### Overview
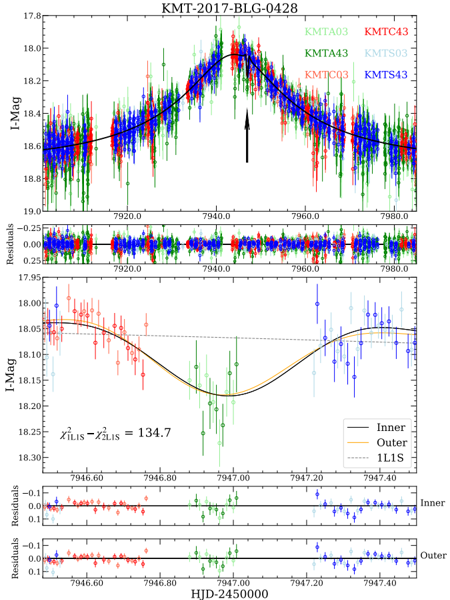
The image presents a light curve analysis of the astronomical event KMT-2017-BLG-0428. It consists of two main plots showing the I-band magnitude (I-Mag) variations over time (HJD-2450000), along with residual plots below each main plot. The data is from multiple telescopes (KMTA03, KMTC43, KMTA43, KMTS03, KMTC03, KMTS43). The analysis includes fitted models (Inner, Outer, 1L1S) to the light curve.
### Components/Axes
**Top Plot:**
* **Title:** KMT-2017-BLG-0428
* **Y-axis:** I-Mag (I-band magnitude), ranging from 17.8 to 19.0.
* **X-axis:** HJD-2450000 (Heliocentric Julian Date minus 2450000), ranging from approximately 7920.0 to 7980.0.
* **Data Series:**
* KMTA03 (Green): Data points scattered around the fitted curve.
* KMTC43 (Red): Data points scattered around the fitted curve.
* KMTA43 (Light Blue): Data points scattered around the fitted curve.
* KMTS03 (Green): Data points scattered around the fitted curve.
* KMTC03 (Red): Data points scattered around the fitted curve.
* KMTS43 (Blue): Data points scattered around the fitted curve.
* **Fitted Curve:** Black line representing the overall trend of the data.
* **Arrow:** A black arrow points to the minimum of the light curve, indicating the peak of the event.
* **Residuals Plot (below top plot):**
* Y-axis: Residuals, ranging from -0.25 to 0.25.
* X-axis: HJD-2450000, ranging from approximately 7920.0 to 7980.0.
* Data points: Residuals corresponding to the data series in the top plot.
**Bottom Plot:**
* **Y-axis:** I-Mag, ranging from 17.95 to 18.30.
* **X-axis:** HJD-2450000, ranging from approximately 7946.60 to 7947.40.
* **Data Series:**
* KMTA03 (Green): Data points showing a dip in magnitude.
* KMTC43 (Red): Data points showing a dip in magnitude.
* KMTA43 (Light Blue): Data points showing a dip in magnitude.
* KMTS03 (Green): Data points showing a dip in magnitude.
* KMTC03 (Red): Data points showing a dip in magnitude.
* KMTS43 (Blue): Data points showing a dip in magnitude.
* **Fitted Curves:**
* Inner (Black): Represents the inner model fit.
* Outer (Orange): Represents the outer model fit.
* 1L1S (Dashed Gray): Represents the 1L1S model fit.
* **Text:** "χ²₁L1S - χ²₂L1S = 134.7"
* **Residuals Plots (below bottom plot):**
* Top Residuals Plot (Inner):
* Y-axis: Residuals, ranging from -0.1 to 0.1.
* X-axis: HJD-2450000, ranging from approximately 7946.60 to 7947.40.
* Data points: Residuals corresponding to the "Inner" model fit.
* Bottom Residuals Plot (Outer):
* Y-axis: Residuals, ranging from -0.1 to 0.1.
* X-axis: HJD-2450000, ranging from approximately 7946.60 to 7947.40.
* Data points: Residuals corresponding to the "Outer" model fit.
### Detailed Analysis
**Top Plot:**
* The I-Mag values generally range from approximately 18.2 to 18.8, with a clear dip (increase in brightness) around HJD-2450000 = 7947.
* The fitted black curve shows a smooth trend, capturing the overall shape of the light curve.
* The residuals in the plot below are scattered around zero, indicating a reasonable fit.
**Bottom Plot:**
* The I-Mag values range from approximately 18.0 to 18.25, focusing on the region around the dip.
* The "Inner" (black) and "Outer" (orange) fitted curves closely follow the data points. The "1L1S" (dashed gray) curve is also shown.
* The residuals in the plots below are centered around zero, indicating a good fit for both "Inner" and "Outer" models.
* The value "χ²₁L1S - χ²₂L1S = 134.7" indicates the difference in chi-squared values between the 1L1S model and another model (likely the 2L1S model), quantifying the improvement in fit.
### Key Observations
* The light curve shows a clear brightening event (decrease in I-Mag) around HJD-2450000 = 7947.
* Multiple telescopes (KMTA03, KMTC43, KMTA43, KMTS03, KMTC03, KMTS43) contribute data to the light curve.
* The "Inner" and "Outer" models provide good fits to the data, as indicated by the residuals.
* The difference in chi-squared values suggests that the 1L1S model provides a different fit compared to the 2L1S model.
### Interpretation
The light curve analysis of KMT-2017-BLG-0428 reveals a significant brightening event, likely due to gravitational microlensing. The data from multiple telescopes ensures a comprehensive view of the event. The fitted models ("Inner," "Outer," and "1L1S") help to characterize the shape and duration of the event. The residuals plots confirm the goodness-of-fit of the models. The difference in chi-squared values between the 1L1S and 2L1S models suggests that the 1L1S model may be a better representation of the data, but further analysis is needed to confirm this. The arrow indicates the peak of the microlensing event.