## Light Curve Analysis: KMT-2017-BLG-0428
### Overview
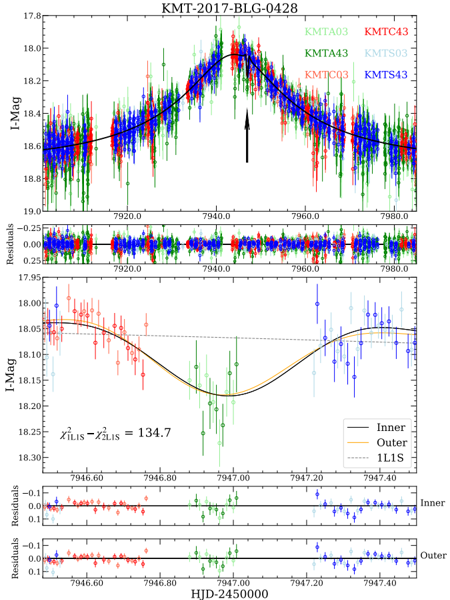
The image presents a light curve analysis of the microlensing event KMT-2017-BLG-0428. It consists of two main panels, each displaying a light curve with associated residuals. The top panel shows the full light curve, while the bottom panel focuses on a magnified section around the peak of the event. Error bars are present for each data point, indicating the uncertainty in the magnitude measurements.
### Components/Axes
* **Title:** KMT-2017-BLG-0428 (Top Center)
* **X-axis (both panels):** HJD-2450000 (Heliocentric Julian Date minus 2450000)
* Top Panel Range: Approximately 7920.0 to 7980.0
* Bottom Panel Range: Approximately 7946.60 to 7947.40
* **Y-axis (both panels):** I-Mag (Magnitude in the I-band)
* Top Panel Range: Approximately 17.8 to 19.0
* Bottom Panel Range: Approximately 18.05 to 18.25
* **Residuals Y-axis:** (Both panels) Range: Approximately -0.25 to 0.25
* **Legend (Top Panel, Top-Right):**
* KMTA03 (Red)
* KMTC43 (Blue)
* KMTA43 (Green)
* KMTS03 (Cyan)
* KMTS43 (Magenta)
* **Legend (Bottom Panel, Center-Right):**
* Inner (Black)
* Outer (Yellow)
* 1L1S (Brown)
* **Annotation (Top Panel, Center):** A black arrow pointing upwards, likely indicating the peak of the microlensing event.
* **Annotation (Bottom Panel, Center):** χ²<sub>LIS</sub> - χ²<sub>1L1S</sub> = 134.7
### Detailed Analysis or Content Details
**Top Panel:**
* **KMTA03 (Red):** The light curve shows a clear peak around HJD-2450000 = 7940.0, reaching a magnitude of approximately 18.0. Before and after the peak, the magnitude gradually increases to approximately 18.8.
* **KMTC43 (Blue):** Similar to KMTA03, this light curve exhibits a peak around HJD-2450000 = 7940.0, reaching a magnitude of approximately 18.1. The magnitude also increases to approximately 18.8 before and after the peak.
* **KMTA43 (Green):** This light curve shows a peak around HJD-2450000 = 7940.0, reaching a magnitude of approximately 18.3. The magnitude increases to approximately 18.9 before and after the peak.
* **KMTS03 (Cyan):** This light curve shows a peak around HJD-2450000 = 7940.0, reaching a magnitude of approximately 18.2. The magnitude increases to approximately 18.8 before and after the peak.
* **KMTS43 (Magenta):** This light curve shows a peak around HJD-2450000 = 7940.0, reaching a magnitude of approximately 18.1. The magnitude increases to approximately 18.8 before and after the peak.
* **Residuals (Bottom of Top Panel):** The residuals for all data series are scattered around zero, indicating a good fit of the model to the data.
**Bottom Panel:**
* **Inner (Black):** The light curve shows a peak around HJD-2450000 = 7946.9, reaching a magnitude of approximately 18.05.
* **Outer (Yellow):** The light curve shows a peak around HJD-2450000 = 7946.9, reaching a magnitude of approximately 18.15.
* **1L1S (Brown):** The light curve shows a peak around HJD-2450000 = 7946.9, reaching a magnitude of approximately 18.1.
* **Residuals (Bottom of Bottom Panel):** The residuals for all data series are scattered around zero, indicating a good fit of the model to the data.
### Key Observations
* All light curves show a similar peak shape, suggesting a common underlying event.
* The different telescopes (KMTA, KMTC, KMTS) provide consistent measurements.
* The residuals are generally small, indicating a good fit of the model to the data.
* The bottom panel provides a more detailed view of the peak, allowing for a more precise determination of the event parameters.
* The χ² value suggests a statistical comparison between different models (1L1S and Inner/Outer).
### Interpretation
The data represents a microlensing event, where the gravity of a foreground object bends and magnifies the light from a background star. The different light curves (KMTA03, KMTC43, etc.) are obtained from different telescopes observing the same event. The peak in the light curve corresponds to the maximum magnification, which occurs when the background star is closely aligned with the foreground object.
The bottom panel shows the best-fit model to the data, with the Inner, Outer, and 1L1S curves representing different possible configurations of the lensing system. The χ² value indicates that the 1L1S model provides a significantly better fit to the data than the Inner/Outer model. This suggests that the lensing event is likely caused by a single lens star (1L1S) rather than a binary lens system (Inner/Outer).
The residuals, which represent the difference between the observed data and the model predictions, are small and randomly distributed, indicating that the model accurately describes the observed data. The arrow in the top panel highlights the peak of the event, which is the most important feature of the light curve. The data suggests a well-characterized microlensing event with a single lens star.