## Line Graph with Residuals and Model Comparisons: KMT-2017-BLG-0428
### Overview
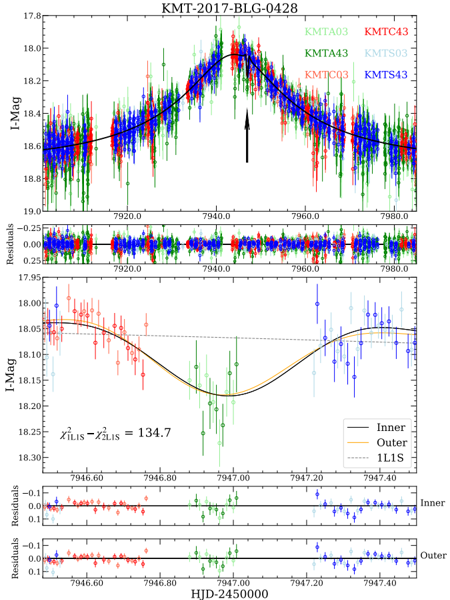
The image presents a multi-panel chart analyzing the light curve of the astronomical object KMT-2017-BLG-0428. It includes three panels:
1. **Top Panel**: Observed data (blue, green, red) with a model fit (black line).
2. **Middle Panel**: Residuals (differences between observed data and model).
3. **Bottom Panel**: Comparison of two models (Inner, Outer) with a dashed line for 1L1S.
### Components/Axes
- **Top Panel**:
- **X-axis**: HJD-2450000 (Heliocentric Julian Date, range: 7920.0–7980.0).
- **Y-axis**: I-Mag (I-band magnitude, range: 17.8–19.0).
- **Legend**:
- Blue: KMTA03
- Green: KMTC43
- Red: KMTA43
- Light Blue: KMTS03
- Light Red: KMTC03
- Light Blue: KMTS43
- **Lines**:
- Black: Model fit (labeled "Inner" in bottom panel).
- Dashed Black: 1L1S (model or hypothesis).
- **Middle Panel**:
- **X-axis**: Same as top panel (HJD-2450000).
- **Y-axis**: Residuals (range: -0.25–0.25).
- **Bottom Panel**:
- **X-axis**: HJD-2450000 (range: 7946.60–7947.40).
- **Y-axis**: I-Mag (range: 18.00–18.30).
- **Lines**:
- Black: Inner model.
- Orange: Outer model.
- Dashed Black: 1L1S.
- **Text**: χ²₁LIS – χ²₂LIS = 134.7.
### Detailed Analysis
- **Top Panel**:
- Observed data (blue, green, red) show variability with error bars.
- The black model line peaks around HJD-2450000 = 7940.0, matching the observed data's peak.
- Residuals (middle panel) oscillate around zero, with deviations up to ±0.25.
- **Bottom Panel**:
- The Inner (black) and Outer (orange) models differ significantly, with a χ² difference of 134.7.
- The 1L1S dashed line (model) aligns closely with the Inner model but diverges slightly.
### Key Observations
- The observed data (blue, green, red) exhibit a clear peak at HJD-2450000 ≈ 7940.0, consistent with the model.
- Residuals in the middle panel suggest minor deviations from the model, possibly due to observational noise or unmodeled effects.
- The χ² difference (134.7) indicates a statistically significant difference between the Inner and Outer models.
### Interpretation
- The chart demonstrates the fit of a model (black line) to observed data, with residuals highlighting potential discrepancies.
- The χ² value (134.7) suggests the Outer model is less likely than the Inner model, as χ² differences above ~10 are typically considered significant.
- The 1L1S line may represent an alternative hypothesis or a specific physical scenario (e.g., lensing parameters).
- The use of multiple colors (blue, green, red) for observed data likely corresponds to different observational bands or datasets, though the legend does not explicitly clarify this.
**Note**: The image contains no explicit textual explanation beyond labels and legends. The χ² value and model comparisons imply a focus on statistical validation of astrophysical models.