## Line Chart: Successful Runs for Reliable Agents in Homogeneous Networks
### Overview
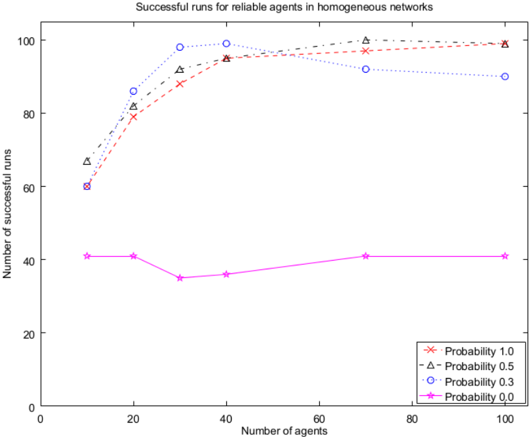
The image is a line chart comparing the number of successful runs for reliable agents in homogeneous networks, across varying numbers of agents and different probability values (1.0, 0.5, 0.3, and 0.0). The x-axis represents the number of agents, ranging from 0 to 100. The y-axis represents the number of successful runs, ranging from 0 to 100.
### Components/Axes
* **Title:** Successful runs for reliable agents in homogeneous networks
* **X-axis Title:** Number of agents
* X-axis values: 0, 20, 40, 60, 80, 100
* **Y-axis Title:** Number of successful runs
* Y-axis values: 0, 20, 40, 60, 80, 100
* **Legend:** Located in the bottom-right corner.
* Probability 1.0 (Red line with 'x' markers)
* Probability 0.5 (Black dashed line with triangle markers)
* Probability 0.3 (Blue dotted line with circle markers)
* Probability 0.0 (Magenta line with star markers)
### Detailed Analysis
* **Probability 1.0 (Red line with 'x' markers):**
* Trend: Initially increases sharply, then plateaus.
* Data Points:
* At 10 agents: ~61 successful runs
* At 20 agents: ~80 successful runs
* At 40 agents: ~92 successful runs
* At 80 agents: ~95 successful runs
* At 100 agents: ~95 successful runs
* **Probability 0.5 (Black dashed line with triangle markers):**
* Trend: Initially increases sharply, then plateaus.
* Data Points:
* At 10 agents: ~67 successful runs
* At 20 agents: ~84 successful runs
* At 40 agents: ~96 successful runs
* At 80 agents: ~99 successful runs
* At 100 agents: ~97 successful runs
* **Probability 0.3 (Blue dotted line with circle markers):**
* Trend: Initially increases sharply, then plateaus.
* Data Points:
* At 10 agents: ~60 successful runs
* At 20 agents: ~86 successful runs
* At 40 agents: ~99 successful runs
* At 80 agents: ~98 successful runs
* At 100 agents: ~90 successful runs
* **Probability 0.0 (Magenta line with star markers):**
* Trend: Relatively flat with a slight dip in the middle.
* Data Points:
* At 10 agents: ~42 successful runs
* At 20 agents: ~41 successful runs
* At 40 agents: ~35 successful runs
* At 80 agents: ~42 successful runs
* At 100 agents: ~42 successful runs
### Key Observations
* Probability values 1.0, 0.5, and 0.3 show a similar trend: a rapid increase in successful runs as the number of agents increases from 10 to 40, followed by a plateau.
* Probability 0.0 consistently results in a significantly lower number of successful runs compared to the other probabilities.
* The number of successful runs for probabilities 1.0, 0.5, and 0.3 are very close to each other, especially after 40 agents.
### Interpretation
The chart suggests that increasing the number of agents in a homogeneous network significantly improves the number of successful runs, but only up to a certain point (around 40 agents). After this point, the increase in successful runs becomes marginal. The probability value has a significant impact on the number of successful runs, with a probability of 0.0 resulting in substantially fewer successful runs compared to higher probabilities. This indicates that the probability parameter is crucial for the success of the agents in the network. The close performance of probabilities 1.0, 0.5, and 0.3 suggests that beyond a certain threshold, increasing the probability may not lead to a significant improvement in performance.