\n
## Line Chart: Successful runs for reliable agents in homogeneous networks
### Overview
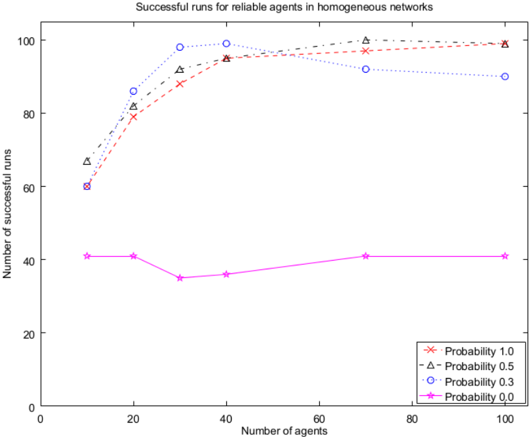
The image is a line chart plotting the "Number of successful runs" against the "Number of agents" for four different probability conditions. The chart demonstrates how the success rate of agents in a network scales with the total number of agents present, under varying levels of a defined probability parameter.
### Components/Axes
* **Title:** "Successful runs for reliable agents in homogeneous networks" (Top center).
* **Y-Axis:** Label: "Number of successful runs". Scale: 0 to 100, with major tick marks at intervals of 20 (0, 20, 40, 60, 80, 100).
* **X-Axis:** Label: "Number of agents". Scale: 0 to 100, with major tick marks at intervals of 20 (0, 20, 40, 60, 80, 100).
* **Legend:** Located in the bottom-right corner of the chart area. It defines four data series:
1. `Probability 1.0`: Red dashed line with 'x' markers.
2. `Probability 0.5`: Black dash-dot line with upward-pointing triangle markers.
3. `Probability 0.3`: Blue dotted line with circle markers.
4. `Probability 0.0`: Magenta solid line with five-pointed star markers.
### Detailed Analysis
**Data Series Trends and Approximate Values:**
1. **Probability 1.0 (Red dashed line, 'x' markers):**
* **Trend:** Shows a strong, steady upward slope that begins to plateau after approximately 40 agents.
* **Data Points (Approximate):**
* 10 agents: ~60 successful runs
* 20 agents: ~78
* 30 agents: ~89
* 40 agents: ~95
* 70 agents: ~97
* 100 agents: ~99
2. **Probability 0.5 (Black dash-dot line, triangle markers):**
* **Trend:** Follows a very similar upward trajectory to Probability 1.0, starting slightly higher and maintaining a marginal lead until the plateau region.
* **Data Points (Approximate):**
* 10 agents: ~66
* 20 agents: ~82
* 30 agents: ~92
* 40 agents: ~96
* 70 agents: ~100
* 100 agents: ~99
3. **Probability 0.3 (Blue dotted line, circle markers):**
* **Trend:** Increases sharply initially, peaks around 30-40 agents, and then shows a slight decline as the number of agents increases further.
* **Data Points (Approximate):**
* 10 agents: ~60
* 20 agents: ~86
* 30 agents: ~98
* 40 agents: ~99
* 70 agents: ~92
* 100 agents: ~90
4. **Probability 0.0 (Magenta solid line, star markers):**
* **Trend:** Remains relatively flat and low across the entire range, showing no significant positive correlation with the number of agents. It fluctuates slightly around the 40 mark.
* **Data Points (Approximate):**
* 10 agents: ~41
* 20 agents: ~41
* 30 agents: ~35
* 40 agents: ~36
* 70 agents: ~41
* 100 agents: ~41
### Key Observations
* **Clear Performance Stratification:** There is a distinct separation between the three non-zero probability series (1.0, 0.5, 0.3) and the zero probability series (0.0). The former group achieves high success rates (60+), while the latter remains below 45.
* **Diminishing Returns:** For the high-performing series (Prob 1.0, 0.5, 0.3), the most significant gains in successful runs occur when increasing the number of agents from 10 to 40. After 40 agents, the curves flatten, indicating diminishing returns.
* **Anomaly in Probability 0.3:** Unlike the top two series which plateau, the Probability 0.3 series exhibits a peak at 30-40 agents followed by a moderate decline, suggesting a potential optimal network size for this specific condition.
* **Convergence at High Agent Counts:** At 100 agents, the success rates for Probability 1.0 and 0.5 converge to nearly the same point (~99), while Probability 0.3 is slightly lower (~90).
### Interpretation
The data suggests a strong positive relationship between the defined "Probability" parameter and the system's ability to achieve successful runs. A probability of 0.0 appears to represent a baseline or failure condition where adding more agents does not improve outcomes.
The rapid initial increase for non-zero probabilities indicates that small networks are highly sensitive to agent count. The plateau after ~40 agents implies that beyond a certain network size, the system reaches its maximum reliable capacity under these conditions, and adding more agents provides little to no benefit for success rate.
The unique behavior of the Probability 0.3 series—peaking and then declining—could indicate a phase transition or a point where network congestion or coordination overhead begins to outweigh the benefits of additional agents for that specific parameter setting. This makes it a critical point for further investigation.
Overall, the chart effectively communicates that both the probability parameter and the number of agents are crucial factors, with their interaction determining the system's performance ceiling and optimal operating point.