## Line Chart: Successful runs for reliable agents in homogeneous networks
### Overview
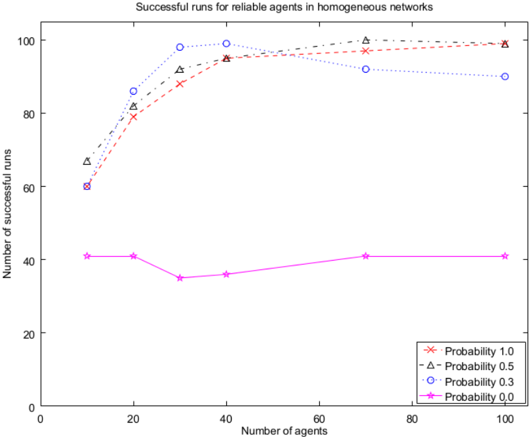
The chart illustrates the relationship between the number of agents in a network and the number of successful runs achieved by agents with varying reliability probabilities. Four distinct data series are plotted, each representing a different probability value (1.0, 0.5, 0.3, 0.0). The y-axis measures successful runs (0-100), while the x-axis tracks agent count (0-100).
### Components/Axes
- **X-axis**: "Number of agents" (0-100, linear scale)
- **Y-axis**: "Number of successful runs" (0-100, linear scale)
- **Legend**:
- Red crosses (×): Probability 1.0
- Black triangles (△): Probability 0.5
- Blue circles (○): Probability 0.3
- Purple stars (★): Probability 0.0
- **Title**: Positioned at the top center of the chart
### Detailed Analysis
1. **Probability 1.0 (Red ×)**:
- Starts at ~60 successful runs when agents = 0
- Increases steadily to ~100 runs by 100 agents
- Slope: ~0.4 runs/agent increment
2. **Probability 0.5 (Black △)**:
- Begins at ~70 runs (agents = 0)
- Rises to ~100 runs by 80 agents
- Plateaus near 100 runs for 80-100 agents
3. **Probability 0.3 (Blue ○)**:
- Starts at ~60 runs (agents = 0)
- Peaks at ~100 runs at 60 agents
- Declines slightly to ~90 runs at 100 agents
4. **Probability 0.0 (Purple ★)**:
- Flat line at ~40 runs across all agent counts
- No visible variation
### Key Observations
- **Highest performance**: Probability 1.0 and 0.5 achieve near-perfect success rates (100 runs) at higher agent counts
- **Optimal scaling**: Probability 0.3 shows maximum efficiency at 60 agents before declining
- **Baseline failure**: Probability 0.0 maintains constant ~40% success rate regardless of agent count
- **Divergence point**: Probability 0.5 outperforms 1.0 at low agent counts (70 vs 60 runs at 0 agents)
### Interpretation
The data demonstrates that agent reliability probability directly correlates with network performance, but with nuanced scaling effects:
1. **Deterministic success** (Probability 1.0) shows linear improvement with agent count
2. **Stochastic reliability** (Probability 0.5) achieves faster saturation but requires fewer agents for peak performance
3. **Intermediate reliability** (Probability 0.3) exhibits a "Goldilocks zone" at mid-scale networks before diminishing returns
4. **Complete unreliability** (Probability 0.0) reveals a systemic failure mode where success remains constant despite network size
Notably, the Probability 0.3 series suggests an optimal network size exists for moderately reliable agents, after which additional agents may introduce coordination challenges or resource contention. This pattern could indicate hidden system dynamics not explicitly modeled in the probability framework.