## Line Graph: Solar Radiation vs. Evaporation Over Time
### Overview
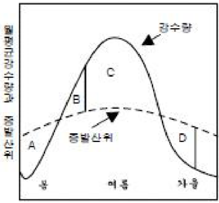
The image depicts a line graph comparing two variables: "광수량" (Solar Radiation) and "증발산위" (Evaporation). The graph shows temporal trends with labeled data points (A, B, C, D) and directional arrows indicating key trends.
### Components/Axes
- **X-axis**: "시간" (Time) – No explicit scale or units provided.
- **Y-axis**: "단위" (Unit) – No explicit scale or units provided.
- **Legend**:
- Solid line: "광수량" (Solar Radiation)
- Dashed line: "증발산위" (Evaporation)
- **Key Labels**:
- "C": Peak of the solid line (Solar Radiation).
- "증발산위" (Evaporation): Dashed line with a downward trend.
- Arrows:
- One pointing to the peak of the solid line (C).
- Another pointing to the dashed line's trend.
### Detailed Analysis
- **Solar Radiation (Solid Line)**:
- Rises sharply to a peak at point **C**.
- Declines gradually after the peak.
- No numerical values provided for the y-axis.
- **Evaporation (Dashed Line)**:
- Follows a smoother, less steep decline compared to Solar Radiation.
- Positioned consistently below the Solar Radiation line.
- No numerical values provided for the y-axis.
- **Data Points**:
- **A**: Low point on the Solar Radiation line (left side).
- **B**: Intermediate point on the Solar Radiation line (left side).
- **C**: Peak of the Solar Radiation line (center).
- **D**: Intermediate point on the Evaporation line (right side).
### Key Observations
1. Solar Radiation peaks at **C**, suggesting a midday or noon-time maximum.
2. Evaporation trends downward but remains below Solar Radiation levels throughout.
3. The dashed line (Evaporation) shows a less pronounced decline than the solid line (Solar Radiation).
4. No explicit numerical values or units are provided for either axis.
### Interpretation
The graph illustrates a relationship between Solar Radiation and Evaporation over time. The peak in Solar Radiation at **C** likely corresponds to the time of maximum sunlight exposure (e.g., solar noon). The Evaporation line’s gradual decline suggests that evaporation rates are influenced by Solar Radiation but may lag or be modulated by other factors (e.g., humidity, temperature). The absence of numerical data limits quantitative analysis, but the visual trends imply that Solar Radiation drives Evaporation, with diminishing returns as the day progresses. The lack of units on both axes introduces uncertainty in interpreting absolute values.